A prometheus exporter for qBitorrent/Transmission/Deluge. Get metrics from multiple servers and offers them in a prometheus format.
You can install this exporter with the following command:
pip3 install downloader-exporterThen you can run it with
downloader-exporter -c CONFIG_FILE_PATH -p 9000
Another option is run it in a docker container.
docker run -d -v CONFIG_FILE_PATH:/config/config.yml -e EXPORTER_PORT=9000 -p 9000:9000 leishi1313/downloader-exporter
Add this to your prometheus.yml
  - job_name: "downloader_exporter"
    static_configs:
        - targets: ['yourdownloaderexporter:port']
You can use params to collector metrics from one or more downloaders as you chose, for example
curl localhost:9000/metrics?name[]=qb1
Will only fetch downloader named qb1 in your config.
Then you can use multi-target-exporter to config your prometheus.
You can use an options to expose multiple ports for each downloader you're watching. Then the exporter will open a range of ports starting from the one you set, each port for each downloader
With command line
downloader-exporter -c CONFIG_FILE_PATH -p 9000 --multi true
With docker
docker run -d -v CONFIG_FILE_PATH:/config/config.yml -e EXPORTER_PORT=9000 -e USE_MULTI_PORTS=true -p 9000-9010:9000-9010 leishi1313/downloader-exporter
Deluge uses three ports for different operations:
- Incoming Port: Used by other torrent clients to connect to your instance.
- WebUI Port: Used to access the Deluge WebUI.
- Daemon Port: The one we need, this port is typically 58846, but you can confirm it by navigating to
Preferences -> Daemonin the Deluge WebUI.
To connect to the daemon, you'll need the daemon username and password. These credentials are stored in a file named auth, located in Deluge's config folder. You can view the file's contents using the following command:
root@f80e4787ec08: cat /config/auth
localclient:011cc7842dc8ad50f165ab712a8ef110e06fd7c0:10
In this example you can use localclient as user and 011cc7842dc8ad50f165ab712a8ef110e06fd7c0 as password to connect.
It's always different on your machine and you can add your choice of user/password by following the existing pattern.
Check more at Deluge Authentication
The config file is compatible with autoremove-torrents, you can also refer to example.yml to see how to write it.
You can use the provided docker-compose.yml to host your own stack of Grafana/Prometheus/downloader-exporter.
Simplely clone this project, add or edit config.yml, then start the docker-compose:
cp example.yml config.yml
docker-compose up -d
Use localhost:3000 and admin/admin to access the dashboard.
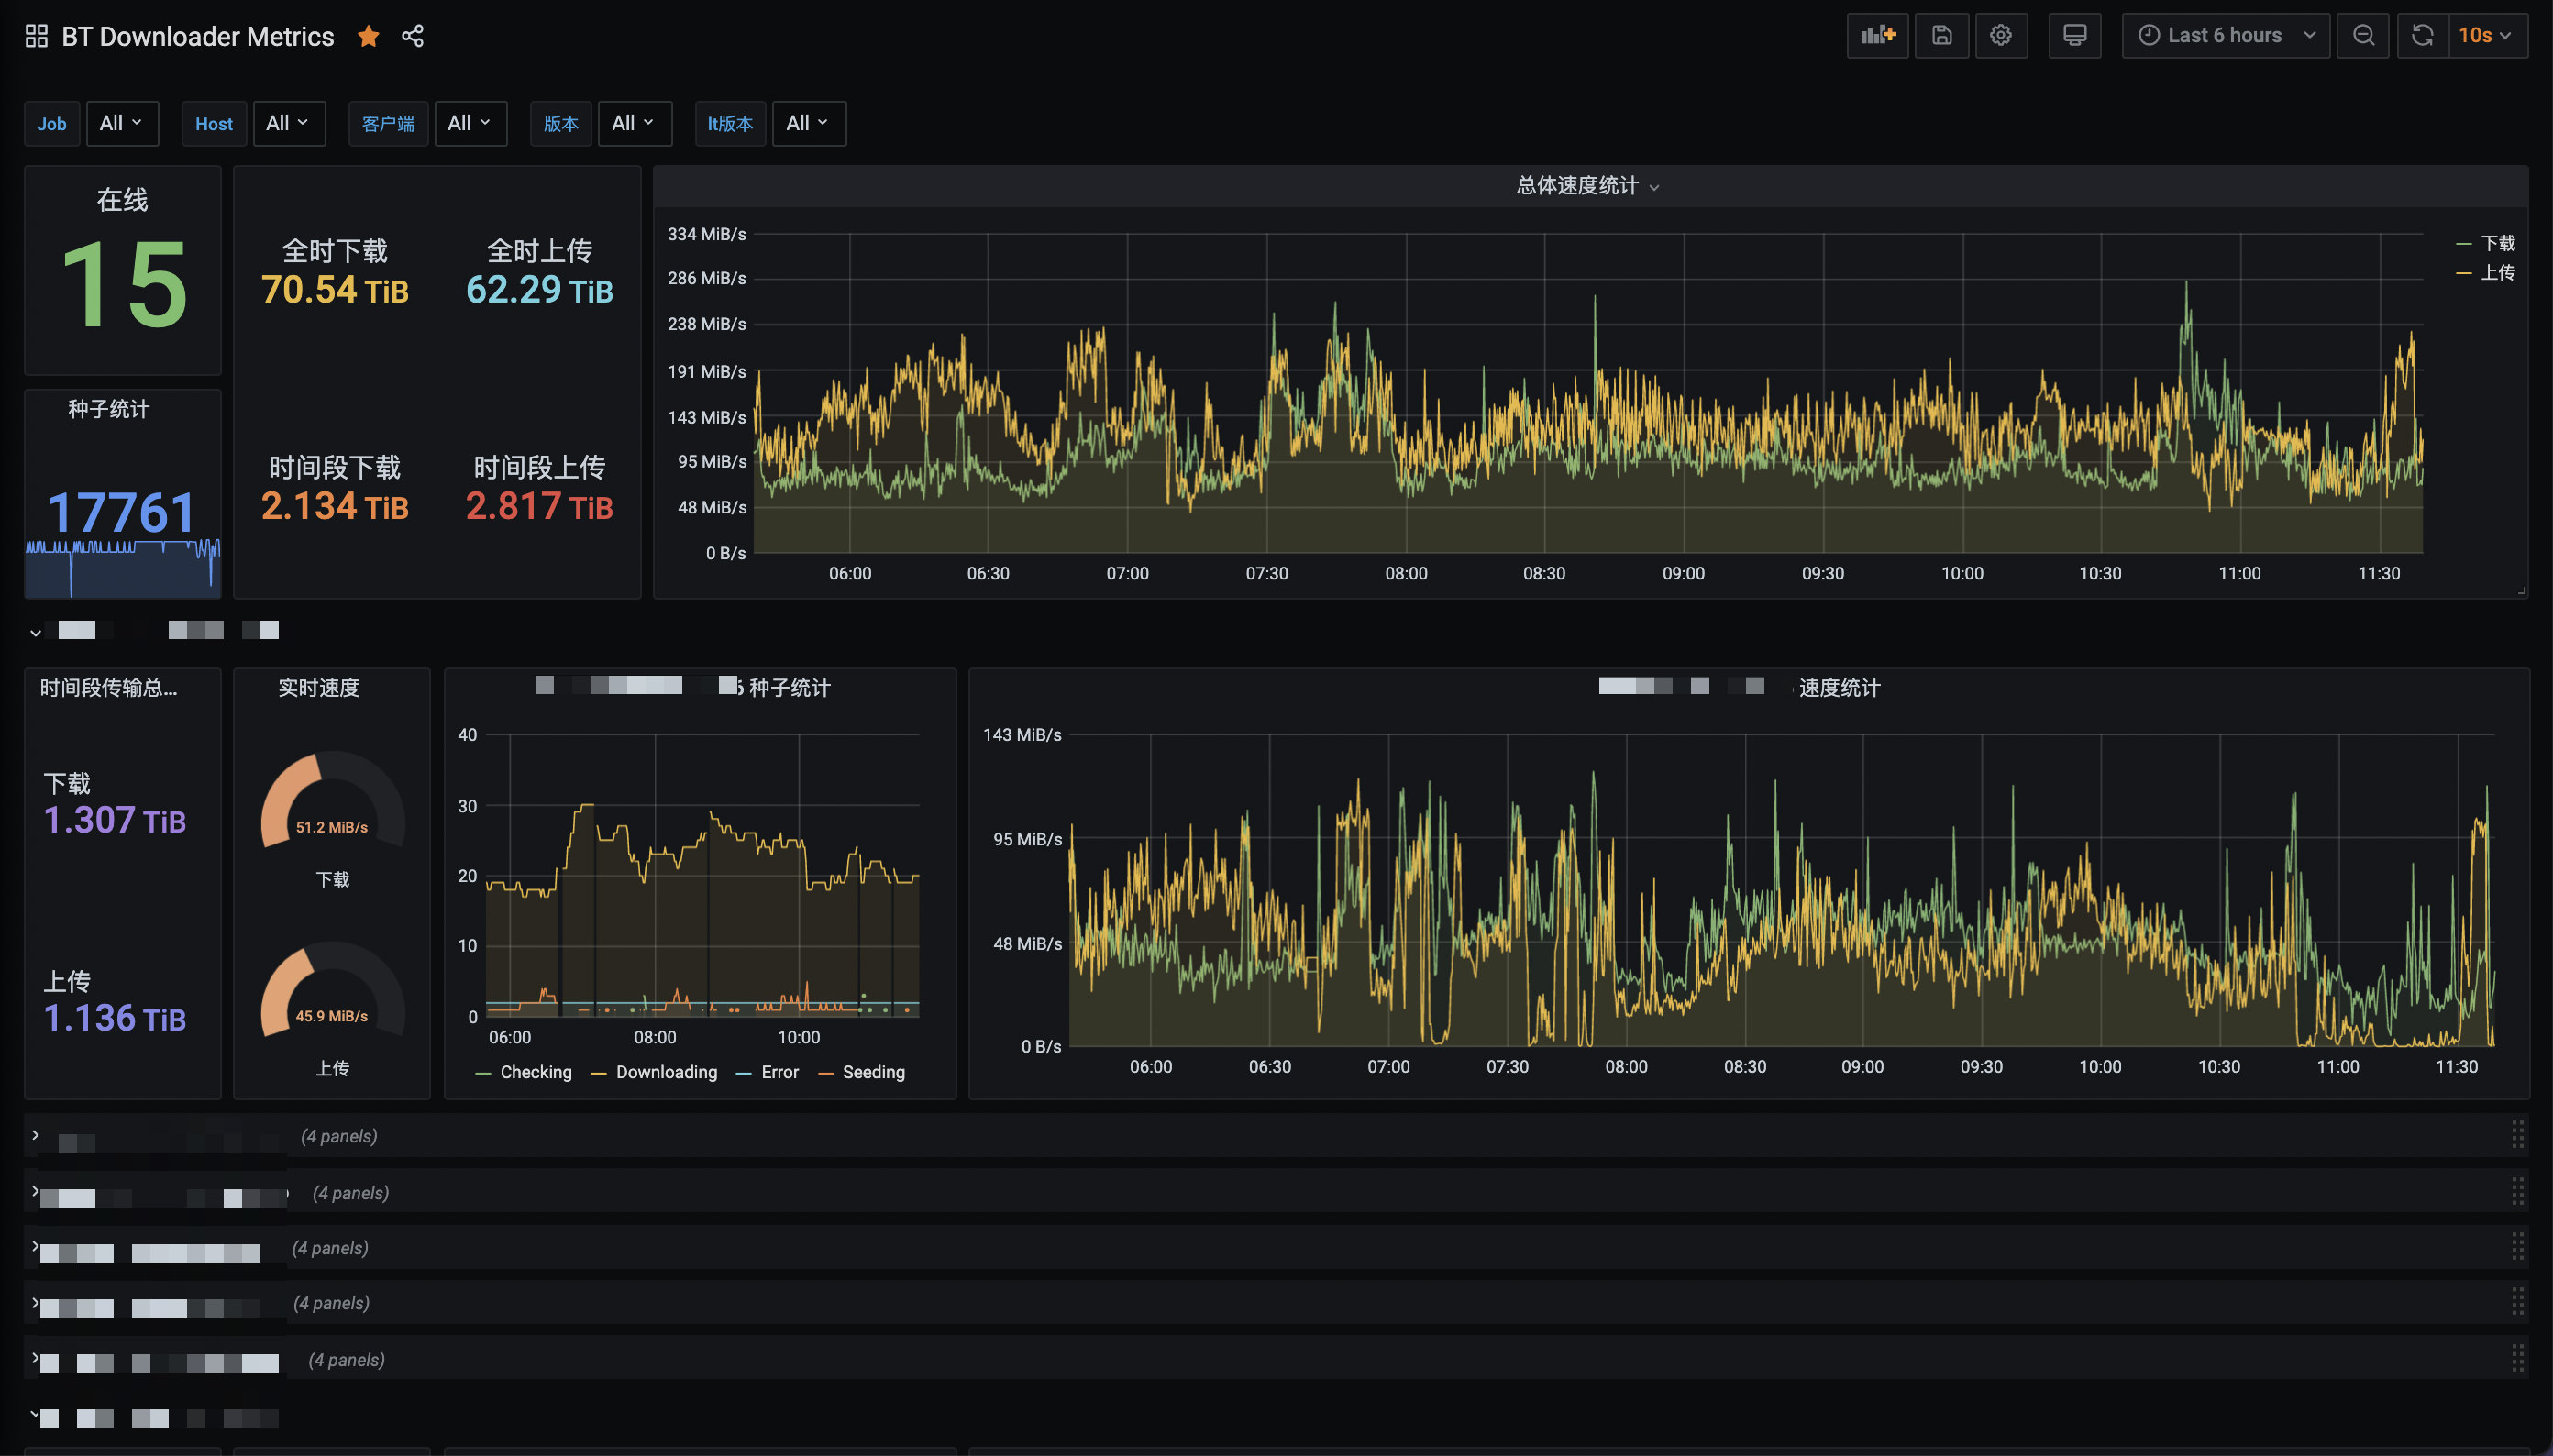
First you will need to add a data source, select Prometheus with URL prometheus:9090, Then go and add a new dashboard with ID 15006 (use 22677 for English version), the dashboard should look like
