Annotate cells/cluster according to a marker list, based on a seurat object
Bash
cd ~/bin/
git clone https://github.com/Maj18/CellAnnotatoRSeurat.git
R
devtools::load_all("~/bin/CellAnnotatoRSeurat")
#devtools::install_github("Maj18/CellAnnotatoRSeurat")
library(Matrix)
library(Seurat)
library(dplyr)
library(ggplot2)
DIR <- "~/bin/CellAnnotatoRSeurat/example/"
INDIR <- paste0(DIR, "/data/")
obj <- readRDS(paste0(INDIR, "gw20_integrated.RDS")) # The dataset is the GW20 data from Zhou et al. 2022 CellStemCell
marker.list <- list(NE=c("VIM", "HMGA2", "ARHGAP28", "ALCAM"), NP=c("NES", "SOX2", "NBPF10", "NBPF15", "PLAGL1", "SFTA3"),
                Neuron=c("STMN2", "SYT1", "SLC32A1", "GAD2", "HDC", "SLC17A6"), OPC=c("PDGFRA", "GPR75-ASB3"),
                OL=c("OLIG2", "GPR75-ASB3", "MBP", "MOG"), Astrocyte=c("AQP4", "AGT", "FAM107A"),
                Ependy=c("CCDC153", "CCDC74A", "CCDC74B", "LRTOMT"), Microglia=c("AIF1", "CX3CR1","ITGAM", "PTPRC"),
                Endoth=c("CLDN5", "FLT1", "SLC38A5"), Mural=c("NDUFA4L2", "PDGFRB"), VLMC=c("PTGDS", "COL1A1"))
classification="integrated_snn_res.0.9" # classification to be annotated
rslt <- annOnMarker(obj=obj, marker.list, classification=classification)
obj <- rslt$obj
Plot annotation by cell, by cluster, as well as by the original classification side by side
cowplot::plot_grid(
    DimPlot(obj, group.by="annotation_cell", label=T, label.box=T, repel=T) + NoLegend(),
    DimPlot(obj, group.by=classification, label=T, label.box=T, repel=T) + NoLegend(),
    DimPlot(obj, group.by="annotation_cluster", label=T, label.box=T, repel=T) + NoLegend(),
    nrow=2
    )
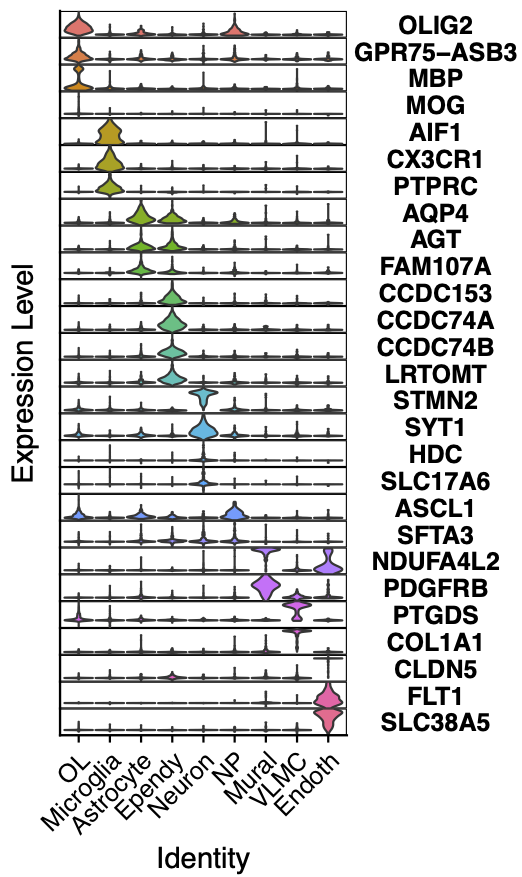
To check the quality of the annotation by cluster, we can make a stacked VlnPlot
stackedVlnPlot(obj, marker.list)
Check the stacked VlnPlot for improper annotation (such as major marker gene does not express)
To improve the annotation, either add new marker genes,
or check the differentially expressed genes of the original classification, to add potentially missed celltypes
or Considering increasing the classification resolution (e.g. from SCT_snn_res.0.1 to SCT_snn_res.0.3).
To check other alternative top annotation for each cluster
rslt$top3ann


