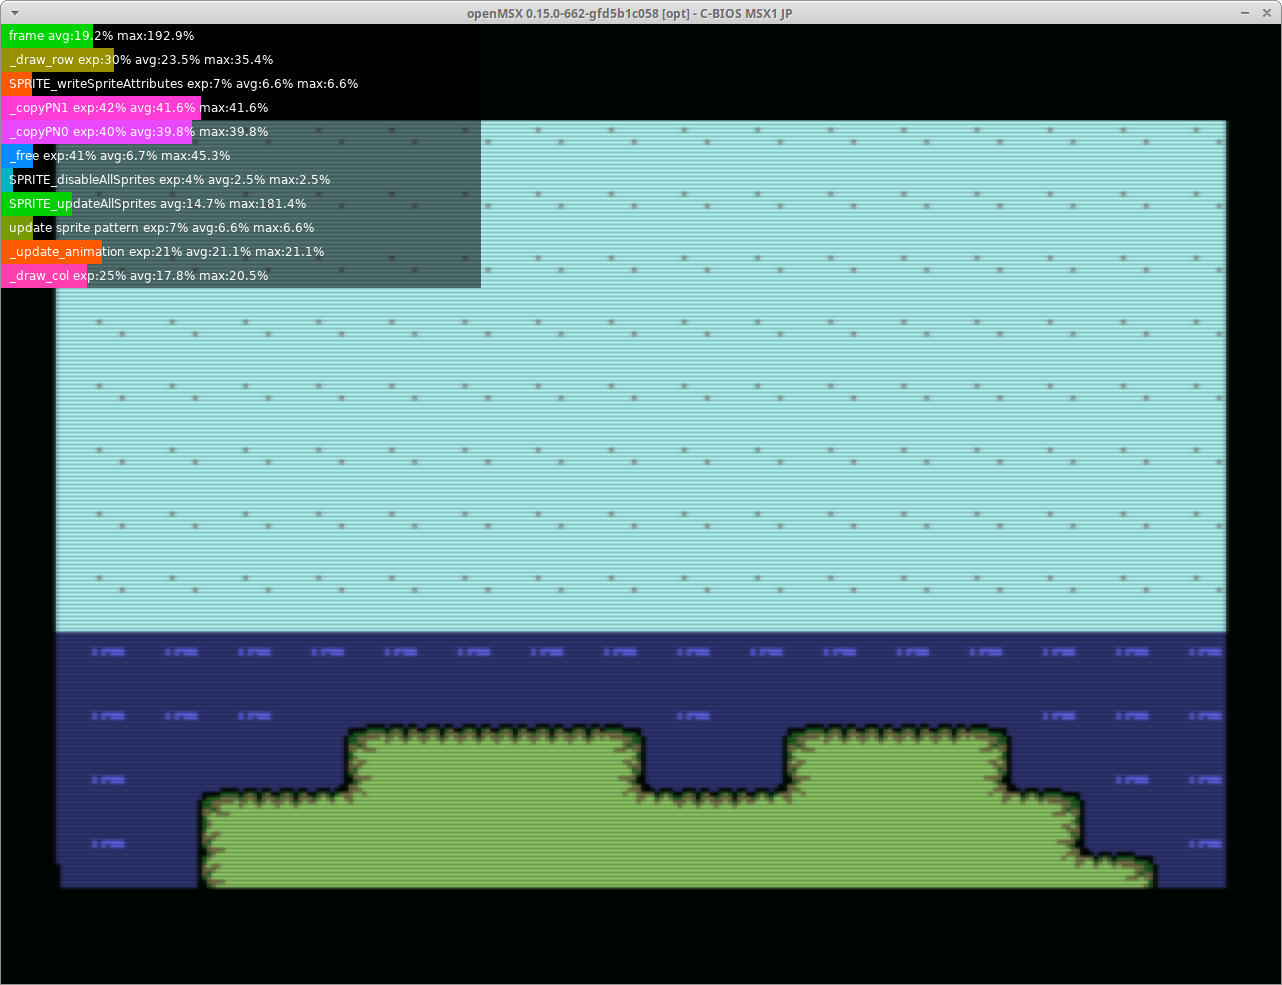
Profiler script for OpenMSX with hooks for easy C code profiling.
This code is based on Laurens Holst profiler, and few instructions were added to better interface with C code. Some examples, documents, and history of this profile is available in the following thread from MRC:
https://www.msx.org/forum/msx-talk/openmsx/performance-profiler-first-attempt
To use the profiler, just copy profile.tcl to ~/.openMSX/share/scripts/, the profiler commands will be made available.
Booting OpenMSX with the argument -command "profile::section_scope_bp frame 0xFD9F; profile_osd p;" will show:
With this utility you can profile the time spent in sections of your code. To measure a section you need to instrument it with TCL script breakpoints to indicate the start and end, and what section it belongs to.
Additionally you can divide the measurements in frame blocks by using the “frame” section. This section is treated as a frame delimiter, and every time this section starts all the section times are reset and the OSD is updated.
It is also possible to exclude the time spent in one section from another. Useful for interrupt handlers and synchronisation wait loops.
Commands:
profile [<ids>] [<unit>]
profile_osd [<unit>]
profile_restart
profile_break <ids>
profile::section_begin <ids>
profile::section_end <ids>
profile::section_begin_bp <ids> <address> [<condition>]
profile::section_end_bp <ids> <address> [<condition>]
profile::section_scope_bp <ids> <address> [<condition>]
profile::section_irq_bp <ids> [<condition>]
profile::section_create <ids>
profile::section_exclude <exclude_ids> <ids>
profile::section_list [<filter_ids>]
profile::section_with <ids> <body>
See help <command> for more information.
Alternatively, the Z80 can start a section by writing any value to I/O port 2Ch.
End a section by writing any value to I/O port 2Dh on the Z80.
In both cases, the address 0xF931 must contain a pointer to a null terminated string with the section name.
Using the profiler while using the SDCC compiler is easy. An example interface to interact is as follows:
#define DEBUG TRUE
#define DEBUG_LEVEL 10

#if defined DEBUG

__sfr __at 0x2C START_PROFILE_SECTION;
__sfr __at 0x2D END_PROFILE_SECTION;

const char * __at 0xF931 DEBUG_MSG_PTR;

#define startProfile(l, msg, expected) do { if (l<DEBUG_LEVEL) { \
    DEBUG_MSG_PTR = #msg; \
    START_PROFILE_SECTION = expected; \
} } while(false)
#define endProfile(l, msg, expected) do { if (l<DEBUG_LEVEL) { \
    DEBUG_MSG_PTR = #msg; \
    END_PROFILE_SECTION = expected; \
} } while(false)

#else
#define startProfile(l, v, expected) do { } while(false)
#define endProfile(l, v, expected) do { } while(false)
#endif

#define PROFILE(level, message, expected, content) do { startProfile(level, message, expected); { content; } isr.cpuLoad += expected; endProfile(level, message, expected); } while(false)I'd like to thank Laurens Holst and all the MRC community for their support!
