Stock Chart is a simple stock visualization framework developed under Linux environment with CMake and Qt. The tool has been tested for both Linux and Windows.
- Python:
- Download stock history data from Yahoo Finance as CSV file.
- Calculate and save stock prices and indicators as CSV file including:
- Prices: Open, High, Low, Close, Adj Close
- Volume
- Moving Average (MA): 5, 10, 20, 30, 60, 120 days
- Exponential Moving Average (EMA): 5, 10, 20, 30, 60, 120 days
- Moving Average Convergence Divergence (MACD)
- BOLLinger bands (BOLL)
- KDJ
- Relative Strength Index (RSI)
- C++:
- Load CSV file into Plot and Chart windows
- Interactive visualizations of different stock prices and indicators in Plot window
- Python: pandas, stock_pandas, datetime, yfinance
- C++: Qt
- Run ExportCSV_Python/exportcsv.py to download stock history data with stock symbol, interval, and time range, e.g. Save 1-day "SPX" data between "12/30/1927" and "12/4/2020" to "spx.csv" file. Note that, the stock history data can also be downloaded directly from Yahoo Finance website.
- Run ExportCSV_Python/readcsv2.py to calculate and save stock and indicators as CSV file, e.g. Save 1-day "SPX" price and indicators to "spxMetric.csv"
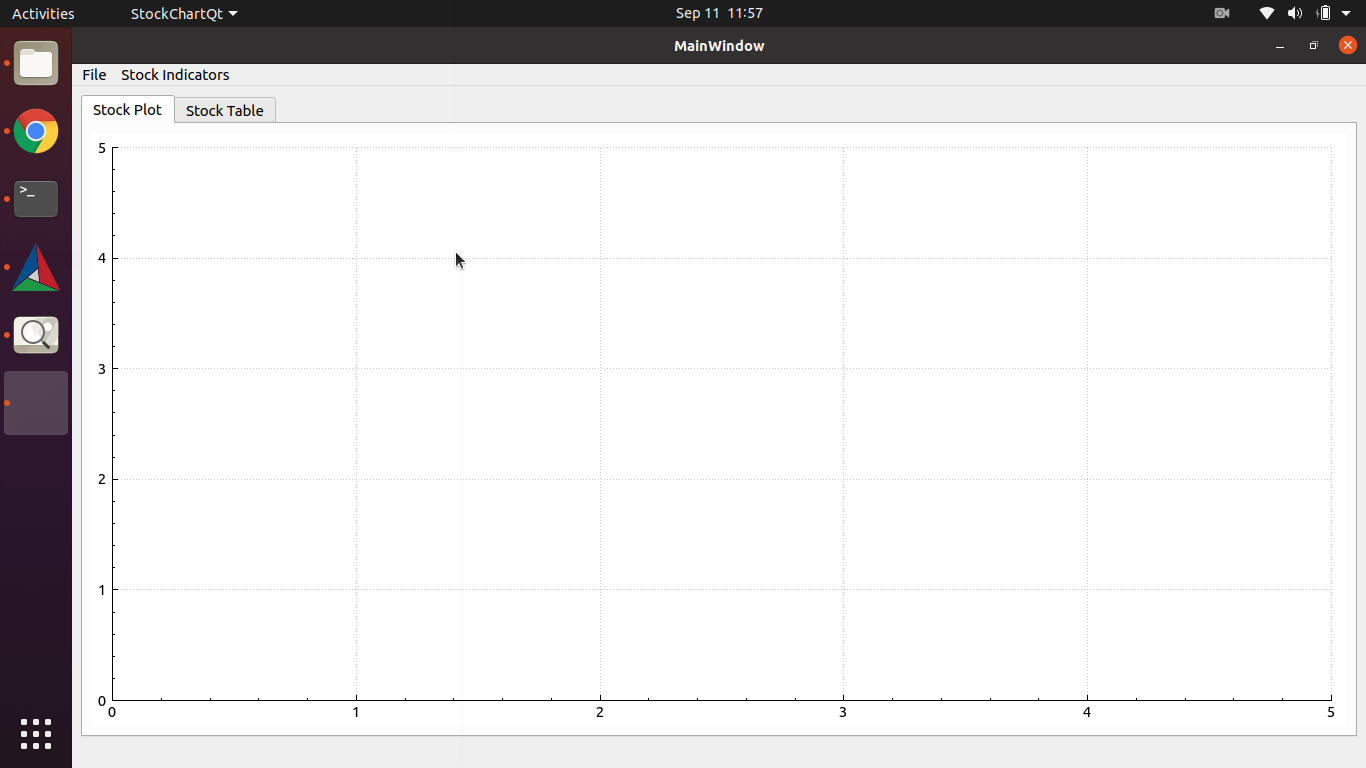
- Run C++ GUI to invoke the Stock Chart and Plotting Tool
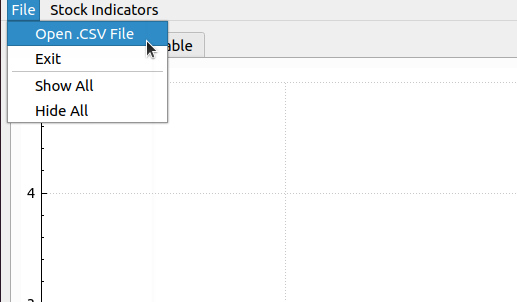
- Under "File" Menu, click "Open .CSV File" and load the "spxMetric.csv" we saved from Python
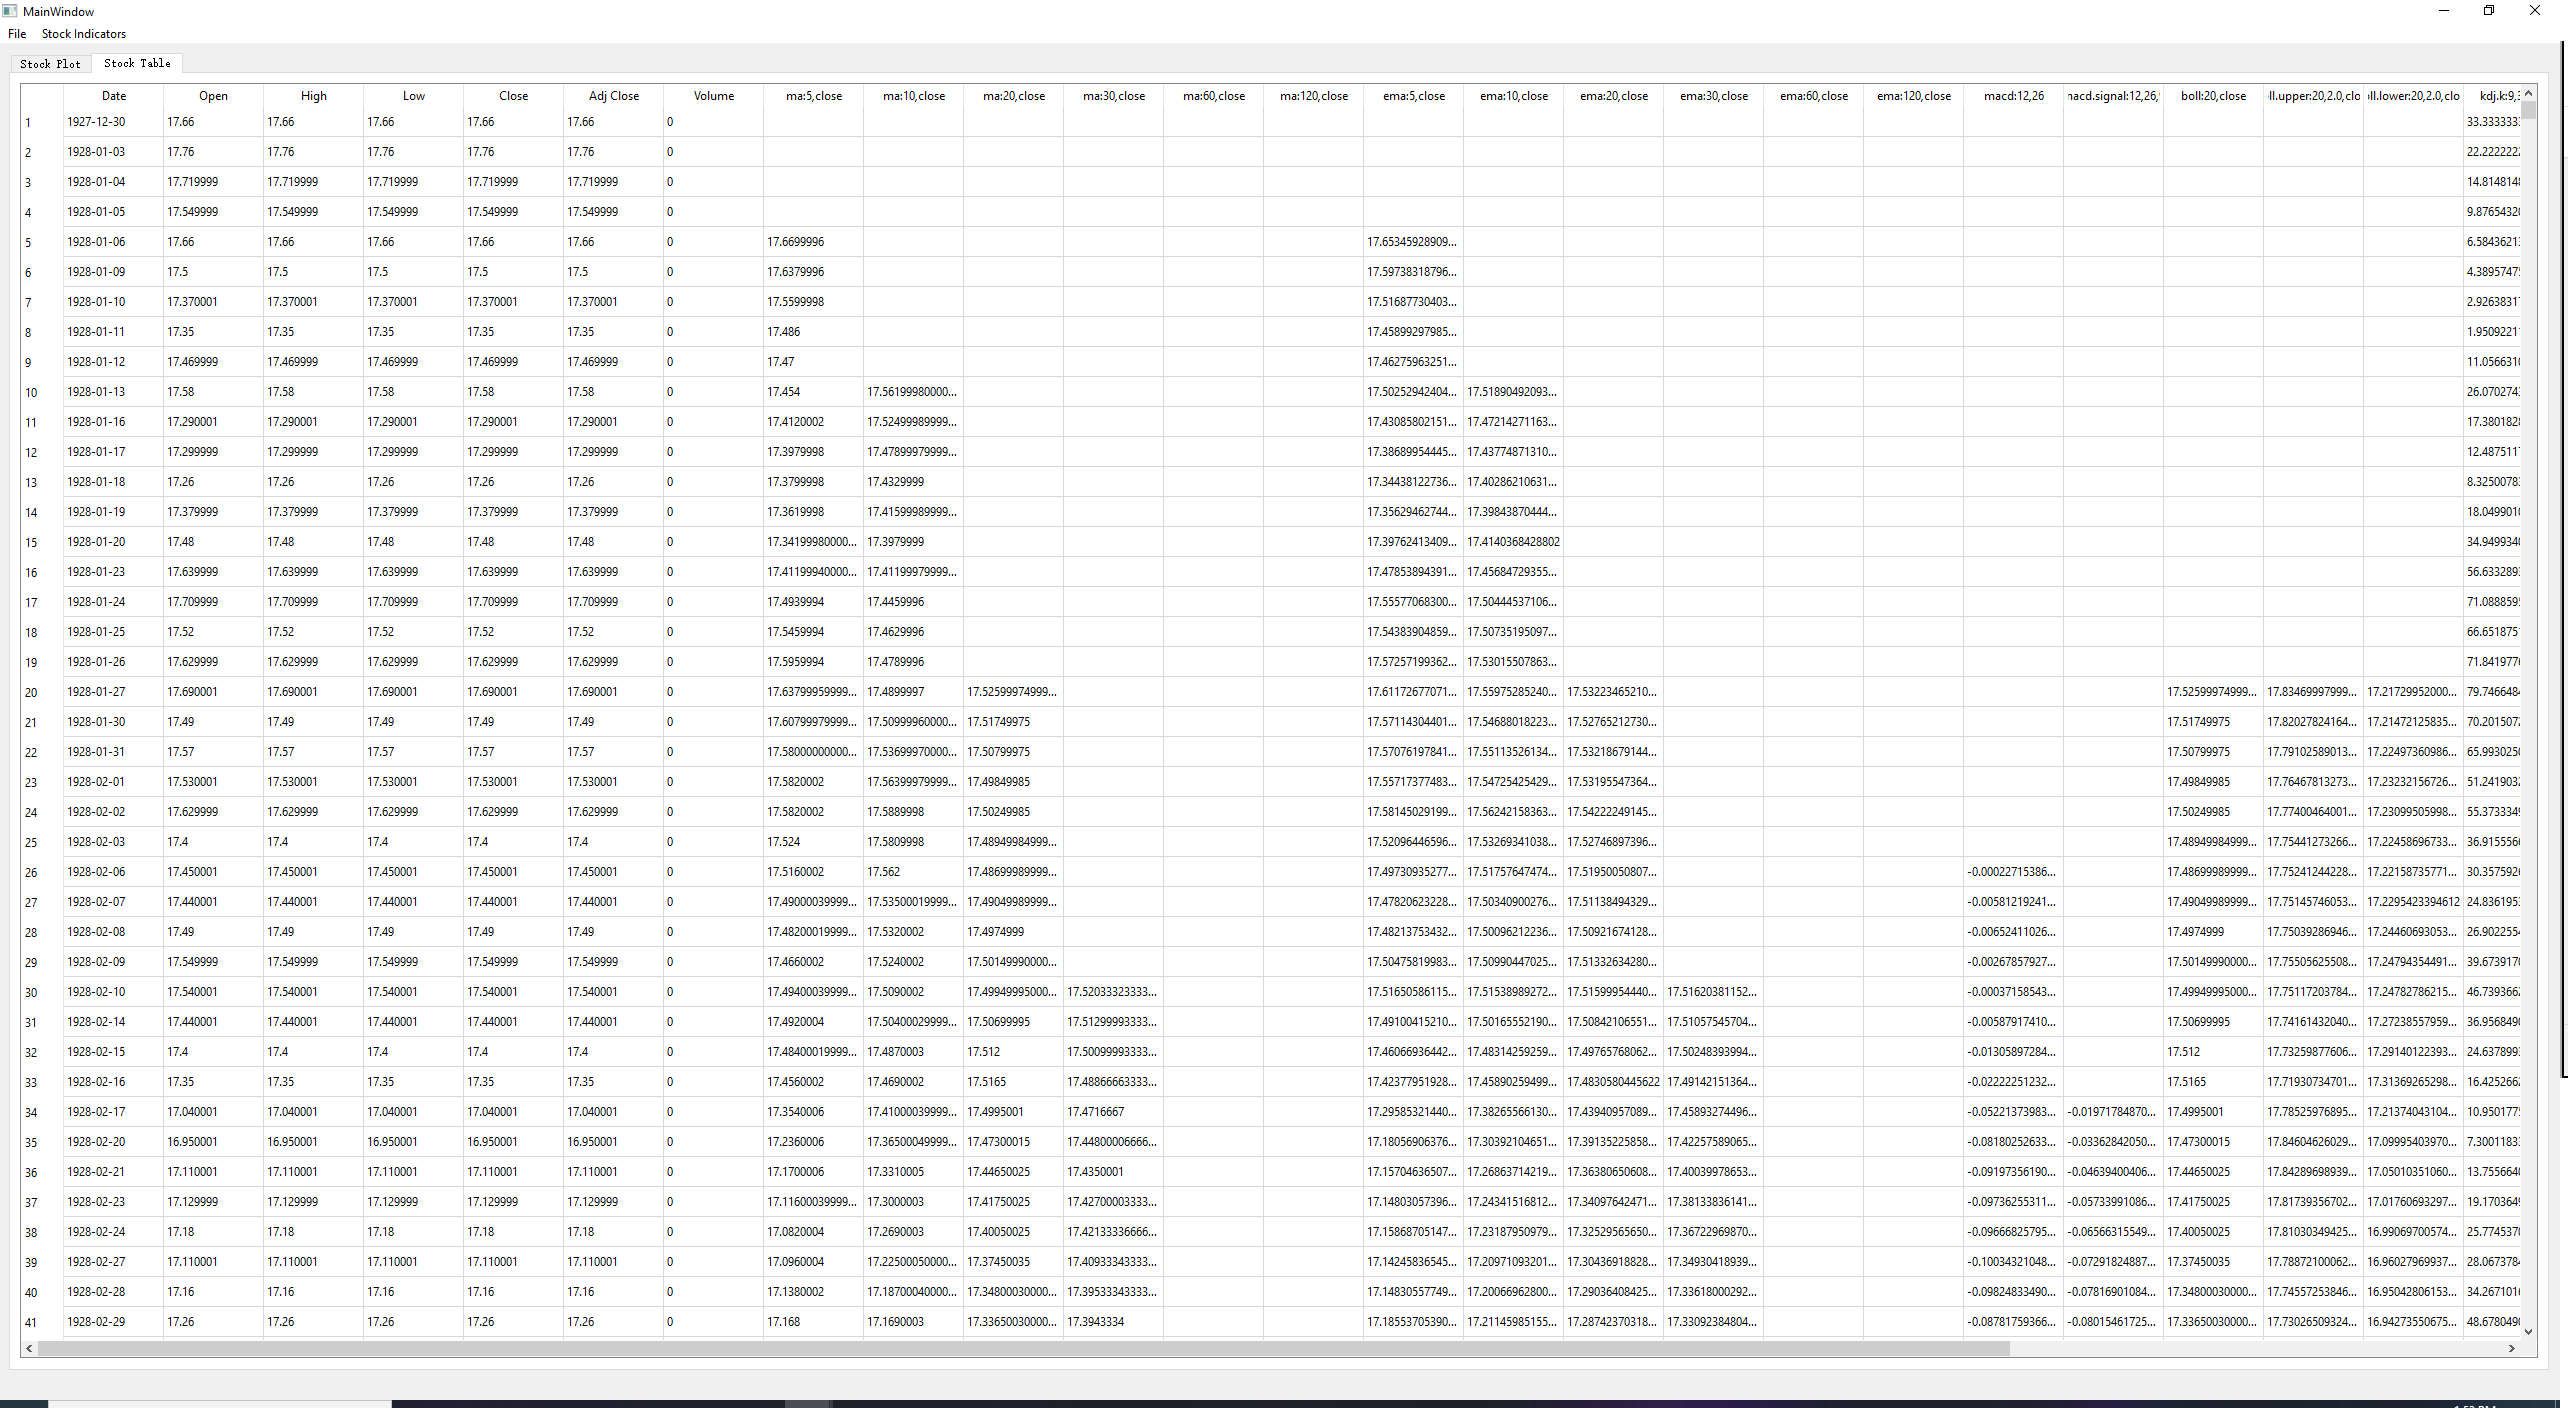
The tool can then read stock data into the "Stock Plot" and "Stock Table" tabs


- Under the "Stock Indicators" menu, the user can show/hide different stock indicators in the Plot window.


- The user can also use mouse wheel and buttons to zoom in and out for a specific date period. The user can also use different combinations of indicators to analyze a stock/index's trend. A few examples below:


