NOTE: This is not an officially supported Google product
SlowJam is a two-part tool for analyzing function latency within Go programs.
stacklog- a library for sampling the stack of a Go program during runtimeslowjam- a binary for visualizing the latency from recorded stack samples
SlowJam excels at finding optimization opportunities in automation workflows, as they tend to block on command-line execution or remote resources, rather than CPU resources. This tool was created from a hackathon hosted by Google's Container DevEx team, with the goal of finding ways to reduce the start-up latency within minikube.
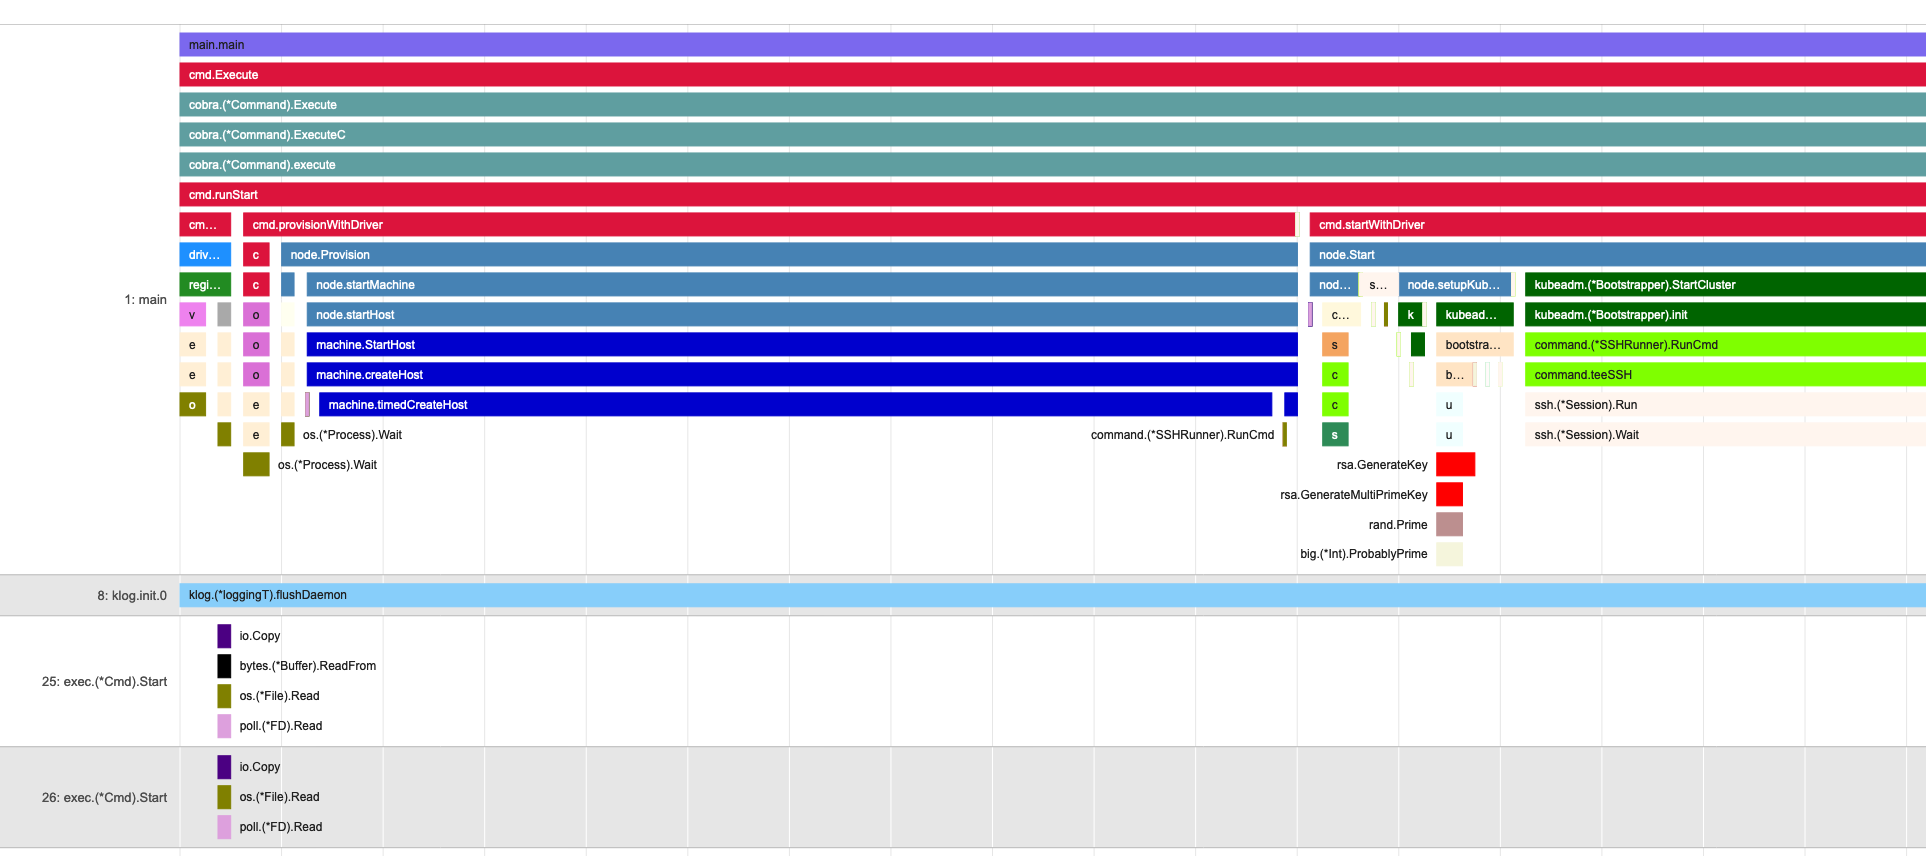
- Hybrid Gantt/Flamegraph visualizations
- Automated sampling of all function calls
- Trivial to integrate
- Zero overhead when inactive, <1% overhead when activated
See example/minikube.html for example output.
- Go v1.14 or higher
Add this to the main() method of your program, or within any other function you wish to record stack samples for:
s := stacklog.MustStartFromEnv("STACKLOG_PATH")
defer s.Stop()
This will invoke the stack sampler if the STACKLOG_PATH environment is set, and will write the stack samples to that location. If you prefer greater control over the configuration, you can also use:
cfg := stacklog.Config{
  Path: "out.slog",
  Poll: 100 * time.Millisecond,
	Quiet: true
}

s, err := stacklog.Start(cfg)
defer s.Stop()
By default, this will poll the stack every 125ms.
Install slowjam:
go install github.com/google/slowjam/cmd/slowjam
Analyze a stacklog using the interactive webserver:
slowjam -http localhost:8080 /path/to/stack.slogTo output a Gantt/Flamegraph chart to out.html:
slowjam -html out.html /path/to/stack.slogTo output a text summary to out.txt:
slowjam -html out.txt /path/to/stack.slogHere's an example PR to integrate SlowJam analysis into minikube: minikube#8329.
With this PR, anyone can generate a slowjam profile:
env STACKLOG_PATH=minikube.slog minikube start
You can then convert the data to various forms, as per the examples/ directory:
slowjam --goroutines 1 --pprof example/minikube.pprof example/minikube.slog
slowjam --html example/minikube.html example/minikube.slog
What minikube contributors discovered with these results were:
- Functions which could obviously be run in parallel were executed in serial.
- Functions which we expected to be fast (<1s) were slow (10s). In many cases we were able to remove or rewrite these functions to do less work.
The net result was a 2.5X reduction in start-up latency: from ~66 seconds to ~26 seconds.

