Network-Performance-Visualization is a tool used to visualize the data produced by various network performance analysis tools. Currently, the project supports the tools NTTTCP, LATTE, and ctsTraffic.
NTTTCP, LATTE, and ctsTraffic are tools used to measure network performance. These tools are quite capable, but they produce dense raw data files as output, and these files can be difficult to draw meaningful conclusions from. Additionally, network performance tests are often run for multiple iterations in order to mitigate the effects of random variance, and this generates directories full of these dense data files. Compiling the network performance data from a set of tests into a usable report can take a group of engineers several days. This is a huge bottleneck which drastically slows the development and testing cycle for networking developers. This visualizer aims to alleviate this pain point.
Given a directory full of NTTTCP, LATTE, or ctsTraffic data files, this tool will parse the raw data, analyze it, and then create tables and charts in excel which provide useful visualizations of that data.
The tool can aggregate data from multiple iterations of network performance monitoring tools and it can be given two directories in order to create side by side comparisons of performance measures before and after system changes.
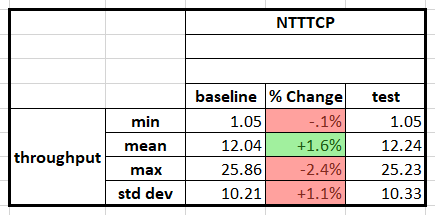
This tool also allows for the selection of pivot variables which are used to subdivide and organize data when the tool is generating reports. For example, here is a table displaying throughput statistics with no pivot variables:
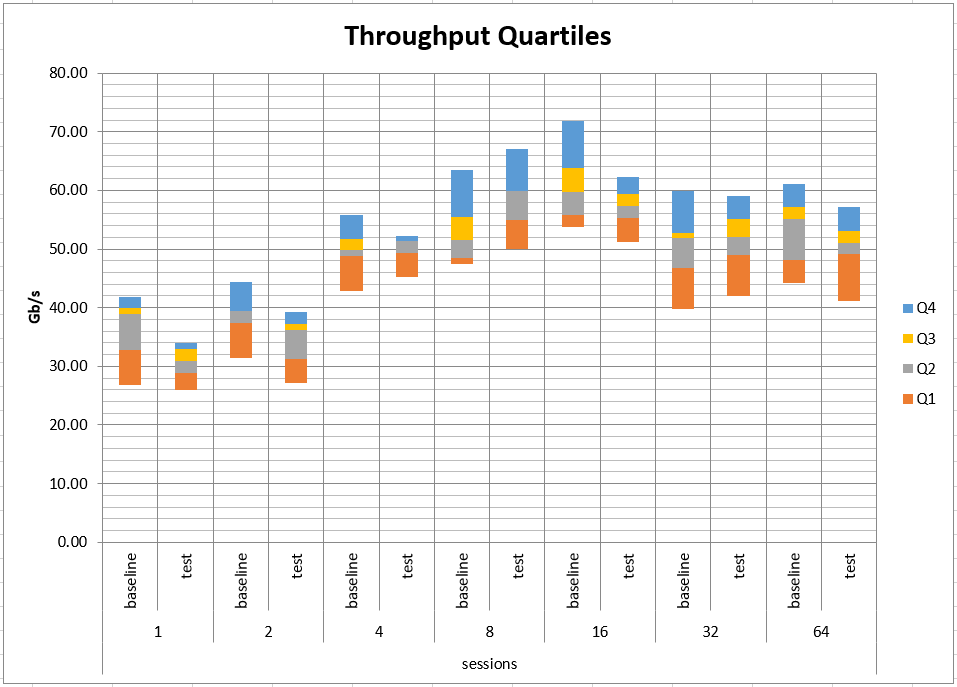
In the table above, there is a single column displaying baseline metrics, and a single column displaying the test metrics. Here is the same data, visualized using sessions as the pivot variable:
In this second table, throughput samples have been grouped into subsets depending on the number of sessions used when making each throughput measurement. Now there are multiple columns displaying test and baseline metrics, with each set of columns being labeled with a pivot variable value. Using a pivot lets us compare performance statistics while holding constant certain parameters, such as sessions in this case. Lastly, here is the same data again, this time visualized using two pivot variables:
In the example above, two pivot variables are used: sessions and buffer count. Just like the previous example, the generated tables have separate columns for each sessions value, but now a separate table is generated for each buffer count value. The pivot variable which splits tables into multiple columns is called the InnerPivot and the pivot variable which causes multiple tables to be created is called the OuterPivot.
Using pivot variables allows for the comparison of data while holding constant certain chosen parameters. This parameter isolation can help pinpoint the causes of performance issues. Pivot variables are optional, and the tool supports using zero, one or two pivot variables.
For more info, visit the tool's Design Document
This module is available on PSGallery, and can be installed using this command:
Install-Module "Network-Performance-Visualization"This module can be manually installed by downloading the repo and copying the Network-Performance-Visualization folder to:
%USERPROFILE%\Documents\WindowsPowershell\Modulesfor PowerShell 5.1%USERPROFILE%\Documents\Powershell\Modulesfor PowerShell Core
This module exports one command called New-NetworkVisualization.
For help and options when running this command directly, use:
Get-Help New-NetworkVisualizationThis project welcomes contributions and suggestions. Most contributions require you to agree to a Contributor License Agreement (CLA) declaring that you have the right to, and actually do, grant us the rights to use your contribution. For details, visit https://cla.opensource.microsoft.com.
When you submit a pull request, a CLA bot will automatically determine whether you need to provide a CLA and decorate the PR appropriately (e.g., status check, comment). Simply follow the instructions provided by the bot. You will only need to do this once across all repos using our CLA.
This project has adopted the Microsoft Open Source Code of Conduct. For more information see the Code of Conduct FAQ or contact [email protected] with any additional questions or comments.


