Based completely on https://github.com/tspspi/pymso5000/tree/master by tspspi
A simple Python library and utility to control and query data from Rigol DHOxxx oscilloscopes. This library implements the Oscilloscope class from the pylabdevs package which exposes the public interface.
When retrieving sample point data from the scope, the number of points retrieved is set by the scope's memory depth.
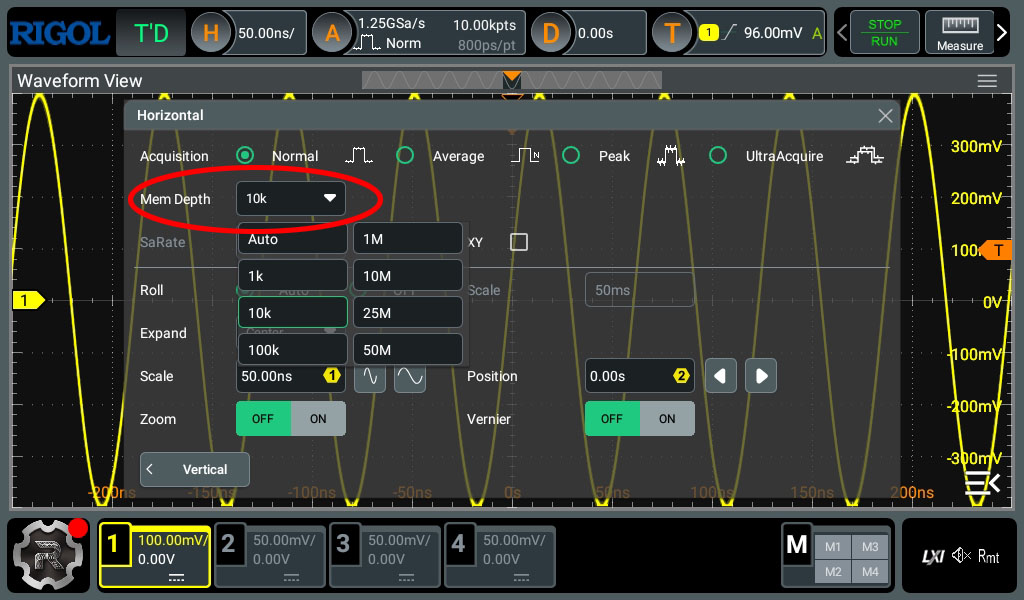
The default memory depth of the scope is set to 10k points. This can be changed through the set_memory_depth() function
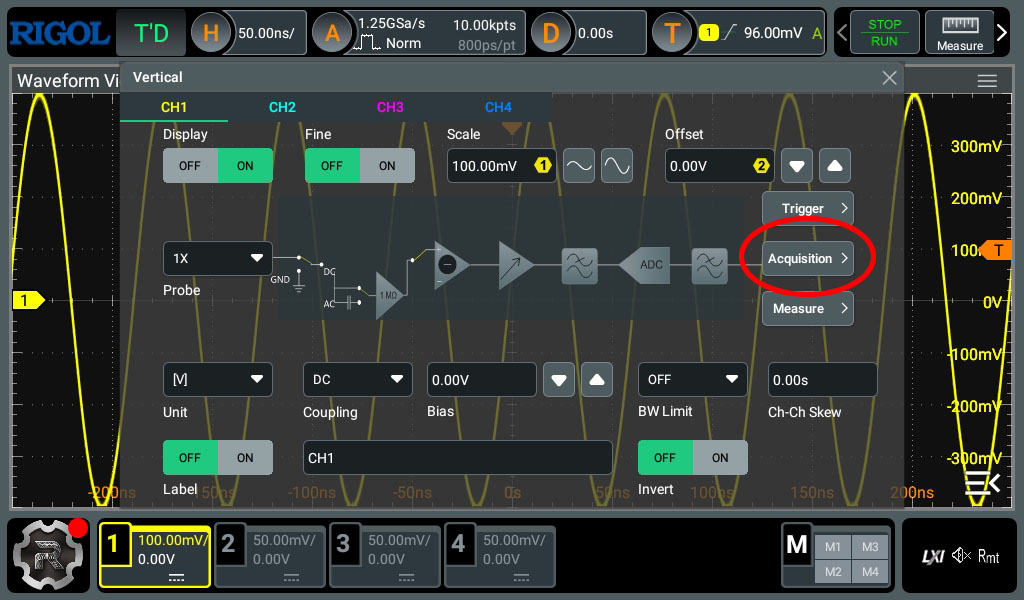
Alternatively this can be changed by accessing the following menus on the scope:
Click on any channel and click "Acquisition":

There is a PyPi package that can be installed using
pip install pydho800
from pydho800.pydho800 import PYDHO800

with DHO800(address = "10.0.0.123") as dho:
    print(f"Identify: {dho.identify()}")

    dho.set_channel_enable(0, True)
    dho.set_channel_enable(1, True)

    dho.set_channel_scale(0,.1)    # 100 mV/div
    dho.set_timebase_scale(100e-6) # 100 us/div

    # Set memory depth to 10 million samples
    tx_depth = dho.memory_depth_t.M_10M
    dho.set_memory_depth(tx_depth)

    # DHO914S/DHO924S specific for the signal generator
    signal_gen_waveform = dho.signal_gen_waveform_t.SINE
    dho.set_signal_gen_waveform(signal_gen_waveform)
    dho.set_signal_gen_amp(3.5)      # 3.5 Vpp
    dho.set_signal_gen_freq(1*10**6) # 1 MHz

    # Back to the oscilloscope
    dho.set_run_mode(OscilloscopeRunMode.RUN)
    dho.set_run_mode(OscilloscopeRunMode.STOP)

    data = dho.query_waveform((0, 1))
    print(data)

    import matplotlib.pyplot as plt
    plt.plot(data['x'], data['y0'], label = "Ch1")
    plt.plot(data['x'], data['y1'], label = "Ch2")

    # Note if only one channel were enabled, it would be accessed by:
    # plt.plot(data['x'], data['y'], label = "Ch1")

    plt.show()
Note that numpy usage is optional for this implementation.
One can enable numpy support using useNumpy = True in the
constructor.
This module allows - via the pylabdevs base class to query
additional statistics:
meanCalculates the mean values and standard deviations- A single value for each channels mean at
["means"]["yN_avg"]and a single value for each standard deviation at["means"]["yN_std"]whereNis the channel number
- A single value for each channels mean at
fftruns Fourier transform on all queried traces- The result is stored in
["fft"]["yN"](complex values) and in["fft"]["yN_real"]for the real valued Fourier transform. AgainNis the channel number
- The result is stored in
ifftruns inverse Fourier transform on all queried traces- Works as
fftbut runs the inverse Fourier transform and stores its result inifftinstead offft
- Works as
correlatecalculates the correlation between all queried waveform pairs.- The result of the correlations are stored in
["correlation"]["yNyM"]for the correlation between channelsMandN
- The result of the correlations are stored in
autocorrelateperforms calculation of the autocorrelation of each queried channel.- The result of the autocorrelation is stored in
["autocorrelation"]["yN"]for channelN
- The result of the autocorrelation is stored in
To request calculation of statistics pass the string for the
desired statistic or a list of statistics to the stats
parameter of query_waveform:
with DHO800(address = "10.0.0.123") as dho:
data = dho.query_waveform((1,2), stats = [ 'mean', 'fft' ])The DHO800/900 has in-built measurement functions. This package release supports the 10 most common used functions:
- VPP: indicates the voltage value from the highest point to the lowest point of the waveform.
- RRPH: indicates the phase deviation between the threshold middle values of the rising edge of Source A and that of Source B.
- FFPH: indicates the phase deviation between the threshold middle values of the falling edge of Source A and that of Source B.
- VMIN: indicates the voltage value from the lowest point of the waveform to the GND.
- VMAX: indicates the voltage value from the highest point of the waveform to the GND.
- VRMS: indicates the root mean square value on the whole waveform or in the gating area.
- VAVG: indicates the root-mean-square value of the waveforms, with the DC component removed.
- OVER: indicates the ratio of the difference between the maximum value and the top value of the waveform to the amplitude value.
- FREQ: defined as the reciprocal of period.
- PER: defined as the time between the middle threshold points of two consecutive, like-polarity edges.
For more detailed information about :MEASure Commands see DHO Progamming Guide (Jul 2023) section 3.17
with DHO800(address = "10.0.0.123") as dho:
    # gets voltage peak to peak
    volt = float(dho.get_channel_measurement(type='VPP', channel=0))
    # gets phase from rising edge refchannel to rising edge channel
phase_riserise = float(dho.get_channel_measurement(type='RRPH',channel=1, refchannel=0))More documentation in progress ...
identify()- Connection management (when not using
withcontext management):connect()disconnect()
set_channel_enable(channel, enabled)is_channel_enabled(channel)set_sweep_mode(mode)get_sweep_mode()set_trigger_mode(mode)get_trigger_mode()force_trigger()set_timebase_mode(mode)get_timebase_mode()set_run_mode(mode)get_run_mode()set_timebase_scale(secondsPerDivision)get_timebase_scale()set_channel_coupling(channel, couplingMode)get_channel_coupling(channel)set_channel_probe_ratio(channel, ratio)get_channel_probe_ratio(channel)set_channel_scale(channel, scale)get_channel_scale(channel)set_channel_bandwidth(channel, scale)get_channel_bandwidth(channel)get_channel_measurement(type, channel[, refchannel])query_waveform(channel, stats = None)off()

