Warning
This project is in early development. The API will change. Please use at your own risk.
Note
What do we want?!?! More Datasources! More Pairs! We welcome PRs 🙏
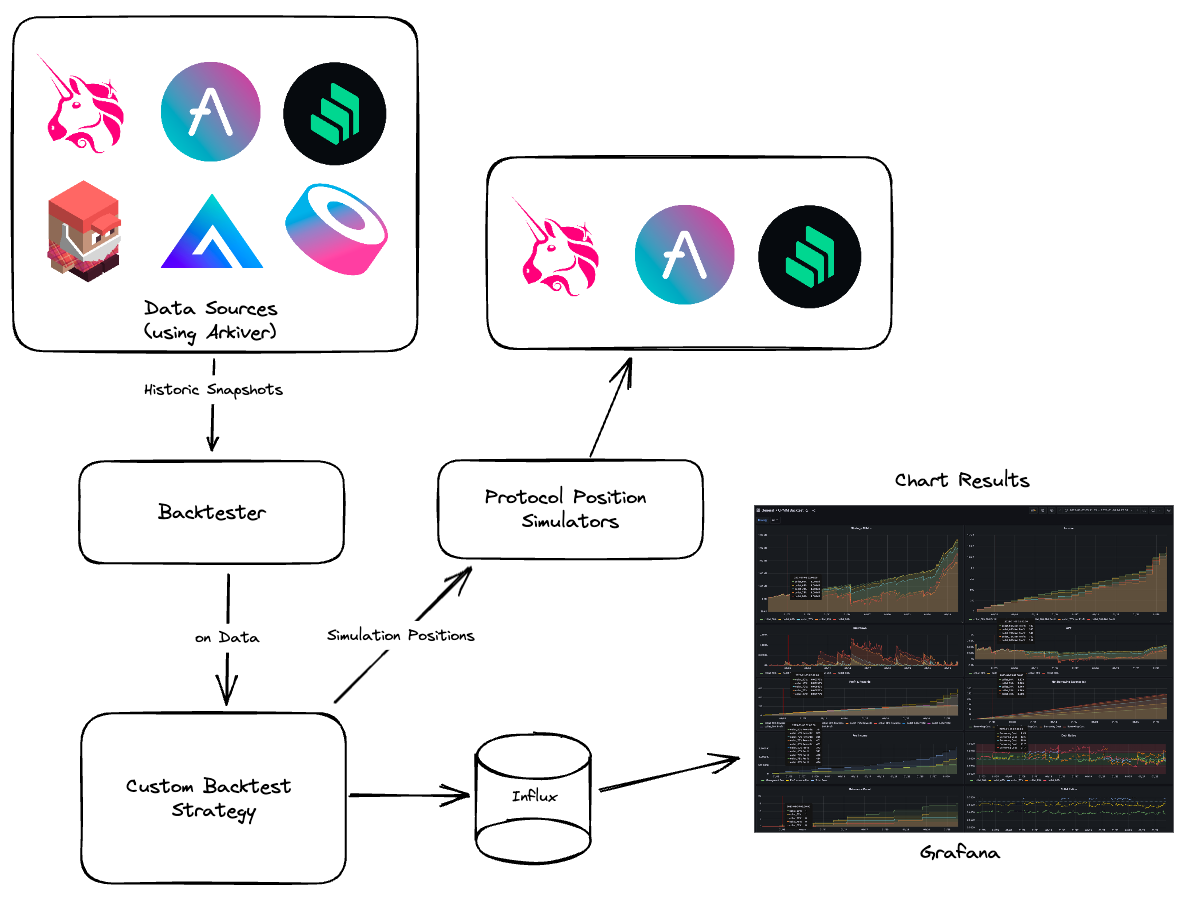
Web3 Backtest is a generic Backtesting library for DeFi trading strategies. The library simplifies pulling historic data, simulating protocols, backtest metrics, charting and analytics.
Web3 Backtester pull desired historic data using arkiver. All data is formatted into snapshots with resolutions of 1m, 1h, or 1day. transaction- or block-resolution may be added in the future.
Datasources are specified with a simple configuration
const sources: DataSourceInfo[] = [
  {
    chain: 'arbitrum',
    protocol: 'camelot-dex',
    resolution: '1m',
    config: {
      pairs: [USDCWETH],
    },
  },
];
Supported sources are detailed [below](#Data Sources Supported)
The library contains helper classes that simulate opening, changing and closing defi positions. For example, the Univ2PositionManager will simulate a position with:
const univ2 = new UniV2PositionManager();
const position = univ2.addLiquidity('WETH/USDC', 1, 1900);
and as cycles pass in the backtest, the position can be monitored and altered
if (position.valueUsd < 2500) {
    { token0, token1 } = position.close()
}
Simulators are in the early stages, the API will change. See Supported Positions Simulators
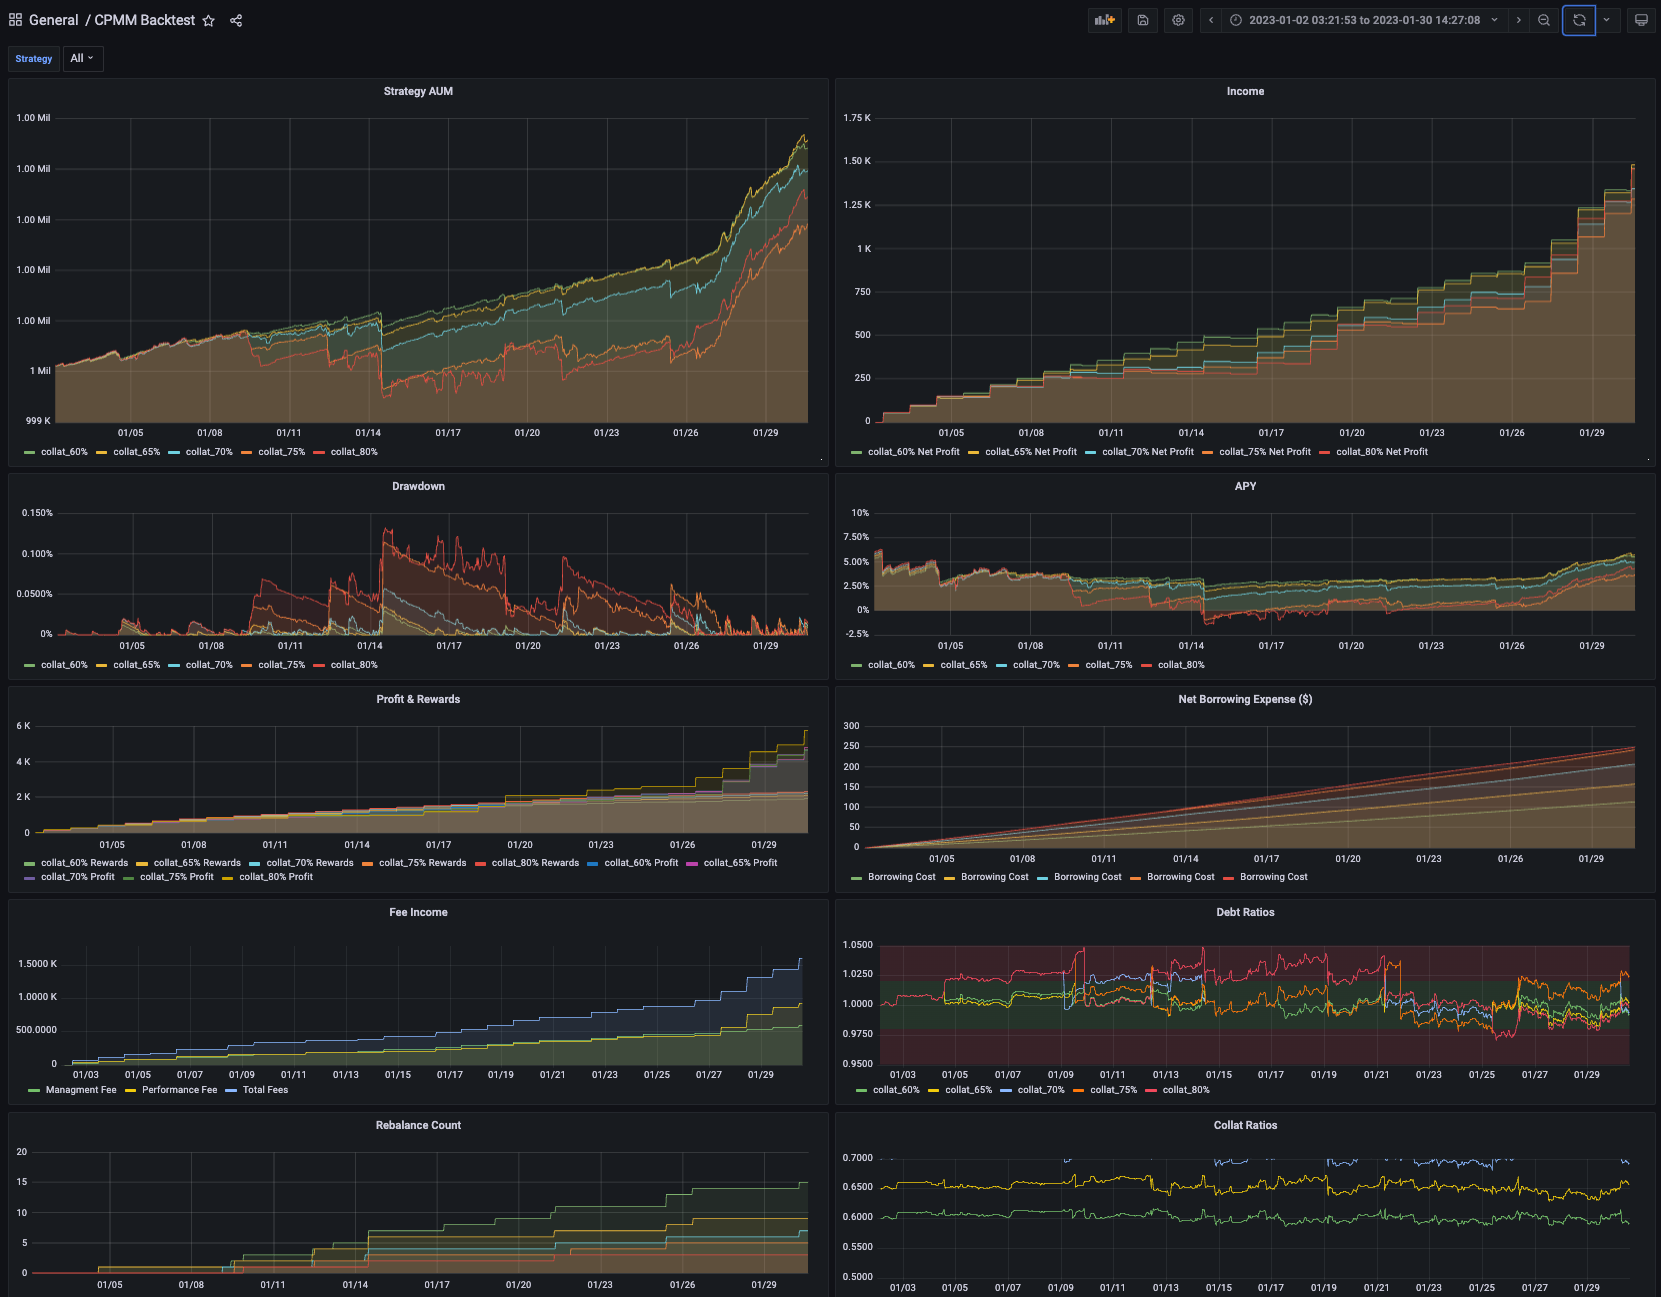
There is a docker-compose.yml file that will spin up an influx db and a local instance of grafana so you can store any data you like during the backtest and have plenty of charting flexibility with grafana.
Web3 Backtester has a simple API that grants flexibility. The steps are:
- Specify Data Sources
- Specify Testing Period
- Register Handlers
- Run the backtest
Here's an example that creates a dummy backtest for a 10 day period, using Camelot 1m resolution data.
const main = async () => {
  const USDCWETH = '0x794a61358D6845594F94dc1DB02A252b5b4814aD';

  const bt = await Backtest.create(
    new Date('2023-01-01'),
    new Date('2023-01-02'),
    [
      {
        chain: 'arbitrum',
        protocol: 'camelot-dex',
        resolution: '1m',
        config: {
          pairs: [USDCWETH],
        },
      },
    ],
  );

  bt.onData(async (update: DataSnapshot<Univ2PoolSnapshot>) => {
    console.log(`we have data for ${update.timestamp}!`);
  });

  bt.onAfter(async () => {
    console.log('backtest complete!');
  });

  bt.run();
};

main();| Feature | Status |
|---|---|
| Generic Data Sources | ✓ |
| Generic Backtest API | ✓ |
| Examples: Hedged Farming Strategy | ✓ |
| Multi-resolution Support (1m, 1d, 1h) | ✓ |
| Influx boilerplate for charting | ✓ |
| NPM Module | ✗ |
| Example: AAVE Folding | ✗ |
| Wallet support for simulators | ✗ |
| Local Data Caching | ✗ |
| Protocol | Status |
|---|---|
| Univ3 | ✓ |
| Univ2 | ✓ |
| AAVE | ✓ |
| Masterchef V2 | ✓ |
| Perp V2 | ✗ |
| Joes V2 | ✗ |
| GMX | ✗ |
| Chain | Protocol | Minutely | Hourly | Hourly |
|---|---|---|---|---|
| Arbitrum | Camelot | ✓ | ✗ | ✗ |
| Arbitrum | Sushiswap | ✗ | ✗ | ✗ |
| Arbitrum | Univ3 | ✗ | ✗ | ✗ |
| Chain | Protocol | Minutely | Hourly | Hourly |
|---|---|---|---|---|
| Arbitrum | AAVE | ✗ | partial | ✗ |
| Avalanche | AAVE | ✗ | partial | ✗ |
| Chain | Protocol | Minutely | Hourly | Hourly |
|---|---|---|---|---|
| Arbitrum | Camelot | ✓ | ✗ | ✗ |
| Arbitrum | Sushiswap | ✗ | ✗ | ✗ |
| Arbitrum | Univ3 | ✗ | ✗ | ✗ |
Grafana and influx are not required to test strategies but they are useful tools for visualising the results.
Run Grafana and influx locally with docker
docker-compose up -d
You can stop the grafana and influx containers with
docker-compose down -v
Install deps
npm install
Run the sample backtest
ts-node ./src/simple.ts
or run the larger example (required influx). First copy the .env template, then run
cp .env.template .env
ts-node ./src/examples/cpmm_camelot_aave/index.ts
Your grafana instance is a fresh instance so there will be no dashboards, you'll need to create them. First step is setting up the influx data source with the following details
| Property | Value |
|---|---|
| name | backtester |
| Query Language | InfluxQL |
| URL | http://influxdb:8086 |
| database | backtest |
| user | admin |
| password | admin |
To input the above data, go to: http://localhost:3000/ then click on the hamburger menu on the left. Proceed to connections then data sources then click "Add new data source" button. Search for InfluxDB and enter the aforementioned fields.
To add an example dashboard, navigate to Dashboards -> New -> Import and paste the json files provided in the /grafana folder.
NOTE: If Grafana failed to connect to localhost, try setting connection mode to server use container name for the URL field. URL: http://influxdb:8086/
Instructions here
- URL: http://host.docker.internal:8086
- Custom header:
- Header: Authorization
- Value: Token 1Vm2wdJdEM9BBxR8LHio1jjgAyx9Glm1SGQqQeBid5QPMqbvdIPjYxMhswV8AKKhA00s-ITdJgJqqJ6cX3cntA==
- Database: backtest
- User: admin
- Password: password
Robo Labs | Neutra Finance | Liquity | Sector Finance
If you would like to support the project, please contact us on Twitter.
If you're looking for to build custom backtests for you, using this library, hit up Robo Labs on Twitter @robolabs_biz.


