An R package of functions for single cell -omics analysis. Fits into Seurat workflow.
devtools::install_github("RoseString/SCOPfunctions")
git clone https://www.github.com/RoseString/SCOPfunctions.git
then from R:
install.packages("./SCOPfunctions", type="source", repos=NULL)
library("SCOPfunctions")
library("Seurat")
Download the example data used in the Seurat hashing vignette at https://satijalab.org/seurat/archive/v3.1/hashing_vignette.html
Follow the initial steps of the hashing vignette up till and including the HTO normalization
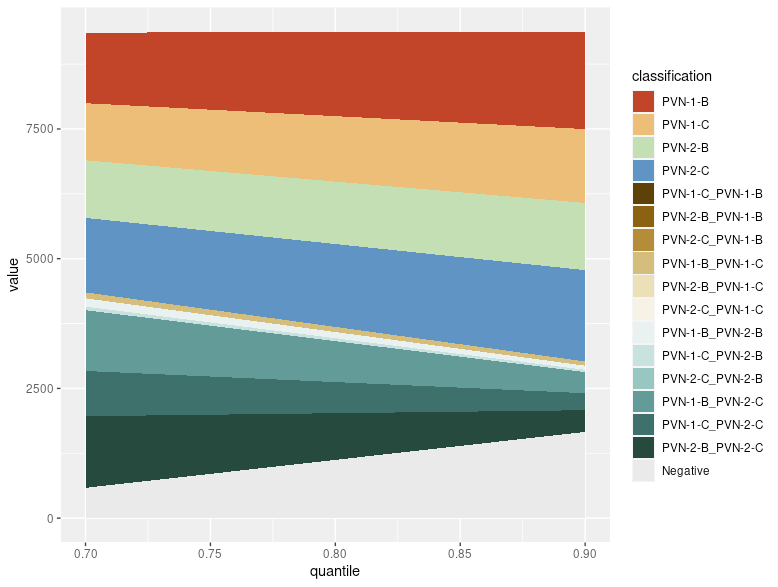
Generate an area plot showing how proportions of singlets, doublets and negatives vary with the positive quantile
p_quantile = SCOPfunctions::prep_HTO_q_area_plot(
  seurat_obj=pbmc.hashtag,
  vec_range_quantile=seq(0.8,0.99,0.01),
  n_cores_max=Inf
)
# First demultiplex hashtags
q = 0.98
pbmc.hashtag = Seurat::HTOdemux(pbmc.hashtag,assay = "HTO", positive.quantile = q)

# use inter-hash doublets to infer intra-hash doublets
pbmc.hashtag = SCOPfunctions::prep_intrahash_doub(
  seurat_obj=pbmc.hashtag,
  assay = "RNA",
  npcs=20,
  randomSeed = 12345
)
Do QC on RNA assay
pbmc.hashtag  = prep_qc_rna(
  seurat_obj=pbmc.hashtag,
  assay = "RNA"
  )
# first find clusters (after normalizing the RNA, finding variable features and scaling the data - not shown)
pbmc.hashtag <- FindNeighbors(pbmc.hashtag, reduction = "pca", dims = 1:20)
pbmc.hashtag <- FindClusters(pbmc.hashtag, resolution = 10, verbose = FALSE)

# find DE genes for cluster 0
df_DE = SCOPfunctions::DE_MAST_RE_seurat(
  object=pbmc.hashtag,
  random_effect.vars="hash.ID",
  test.use = "MAST",
  ident.1 = "0",
  group.by = "seurat_clusters"
)
find the activity values for a geneset
# as an example, just use the top DE genes for cluster 0
vec_geneWeights <- seq(from = 1, to = 0.1, by = -0.1)
vec_geneWeights <- vec_geneWeights/sum(vec_geneWeights)

names(vec_geneWeights) =  head(rownames(df_DE), 10)

pbmc.hashtag$my_geneset_embeddings <- geneset_embed(
  mat_datExpr = as.matrix(GetAssayData(pbmc.hashtag, slot="scale.data", assay="SCT")),
  vec_geneWeights=vec_geneWeights,
  min_feats_present = 5)
find the activity values for a list of genesets
pbmc.hashtag <- geneset_embed_list_seurat(
  seurat_obj = pbmc.hashtag,
  list_vec_geneWeights=list_vec_geneWeights,
  slot="scale.data",
  assay="SCT",
  min_feats_present = 5,
  n_cores_max = Inf)
plot the distribution of cell clusters in different samples
plot_barIdentGroup(seurat_obj=pbmc.hashtag,
                    var_ident="sample_ID",
                    var_group="cluster",
                    vec_group_colors=NULL,
                    f_color=colorRampPalette(brewer.pal(n=11, name="RdYlBu")),
                    do_plot = F)
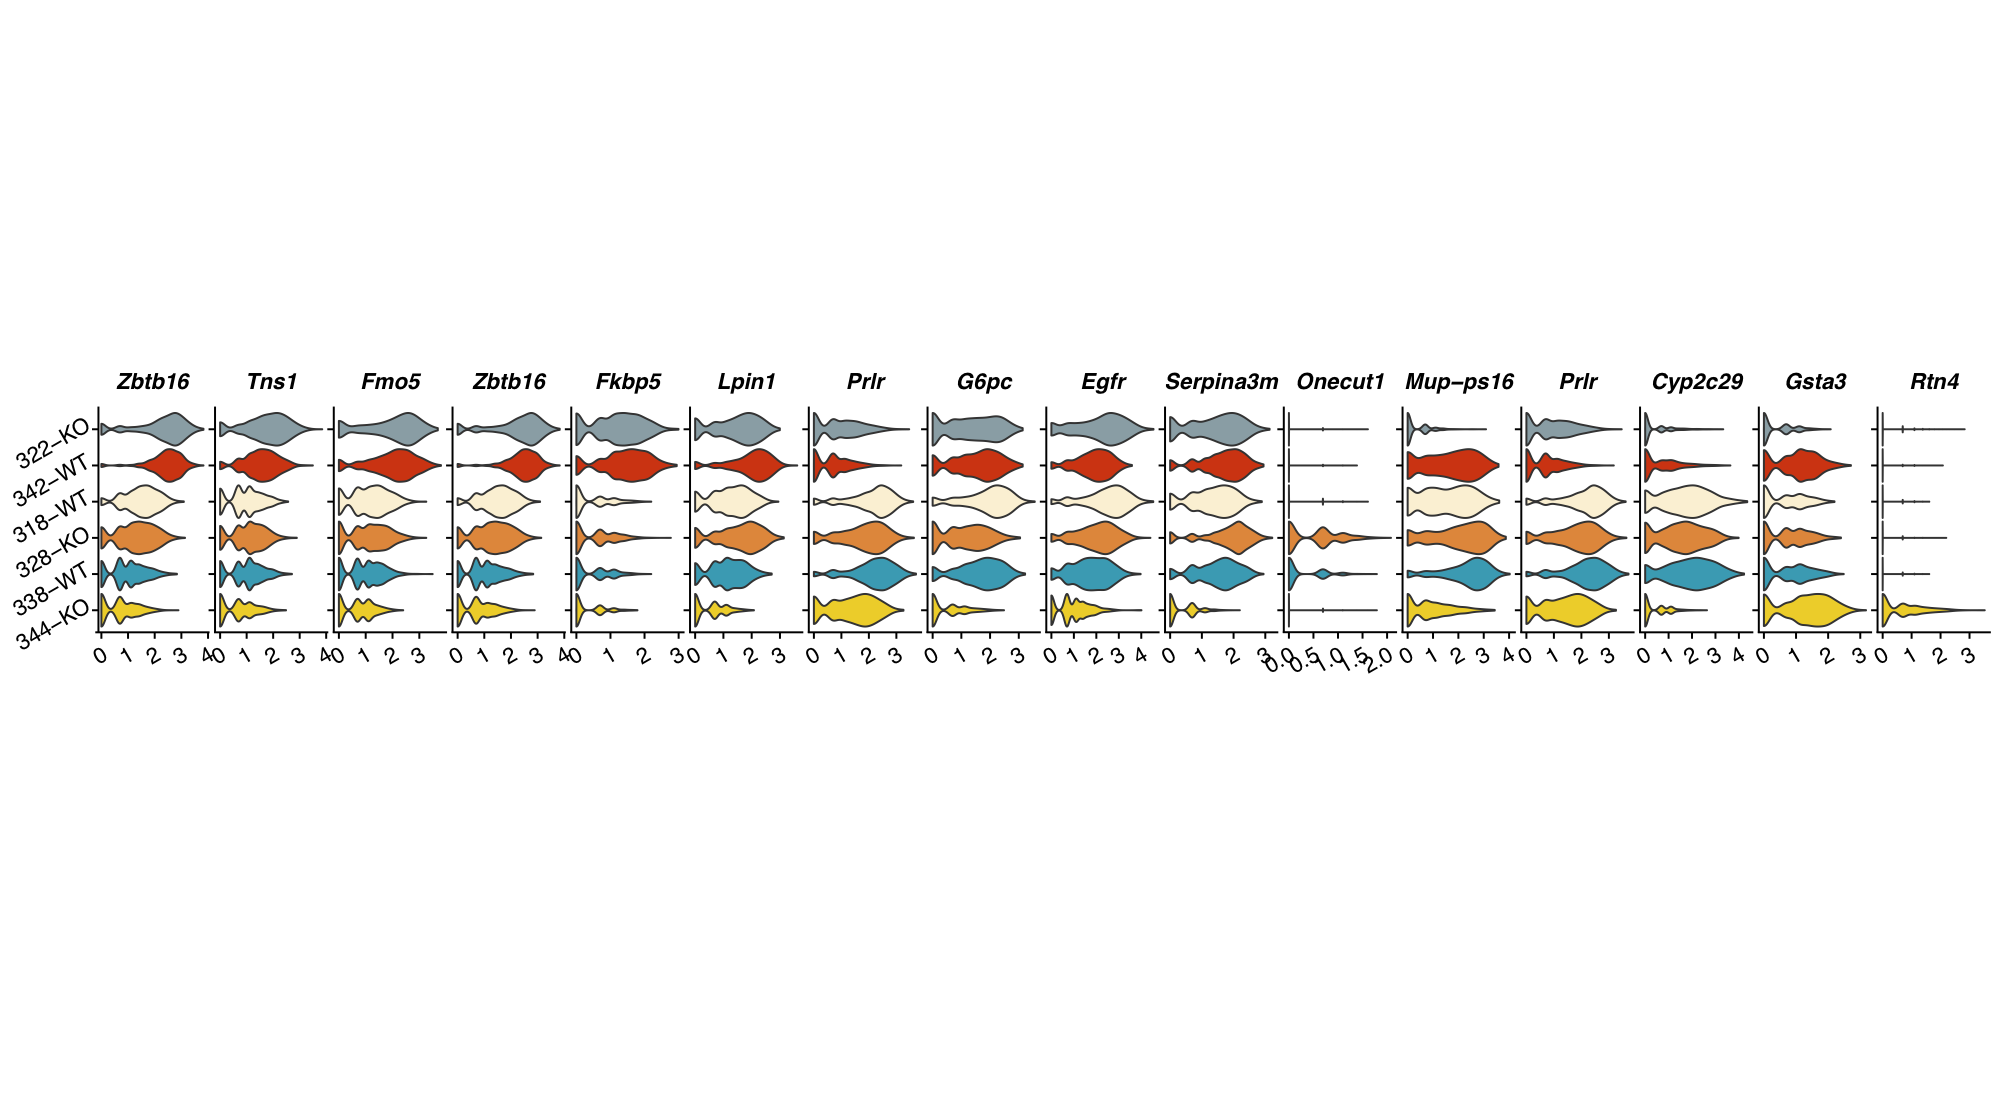
plot a cluster * feature grid of gene expression violin plots
# Here we just use the top variable genes, but normally we would use cluster marker genes
plot_vlnGrid(seurat_obj,
              slot="data",
              var_group="cluster",
              vec_features=head(VariableFeatures(seurat_obj),n=15),
              vec_group_colors=NULL,
              f_color = colorRampPalette(brewer.pal(n=11, name="RdYlBu")))
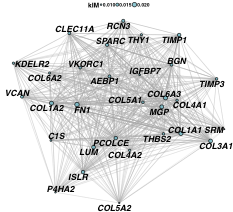
make a network plot of a set of co-expressed features
SCOPfunctions::plot_network(
  mat_datExpr=as.matrix(GetAssayData(seurat_obj, slot="data")),
  vec_geneImportance=vec_geneImportance,
  vec_genes_highlight=c(),
  n_max_genes=50,
  igraph_algorithm = "drl",
  fontface_labels="bold.italic",
  color_edge = "grey70",
  edge_thickness = 1)
Issues and pull requests are welcome! All contributions should be in line with the usethis code of conduct. This package uses the methods and R tools set out in R packages. All Pull Requests should follow the tidyverse style guide.


