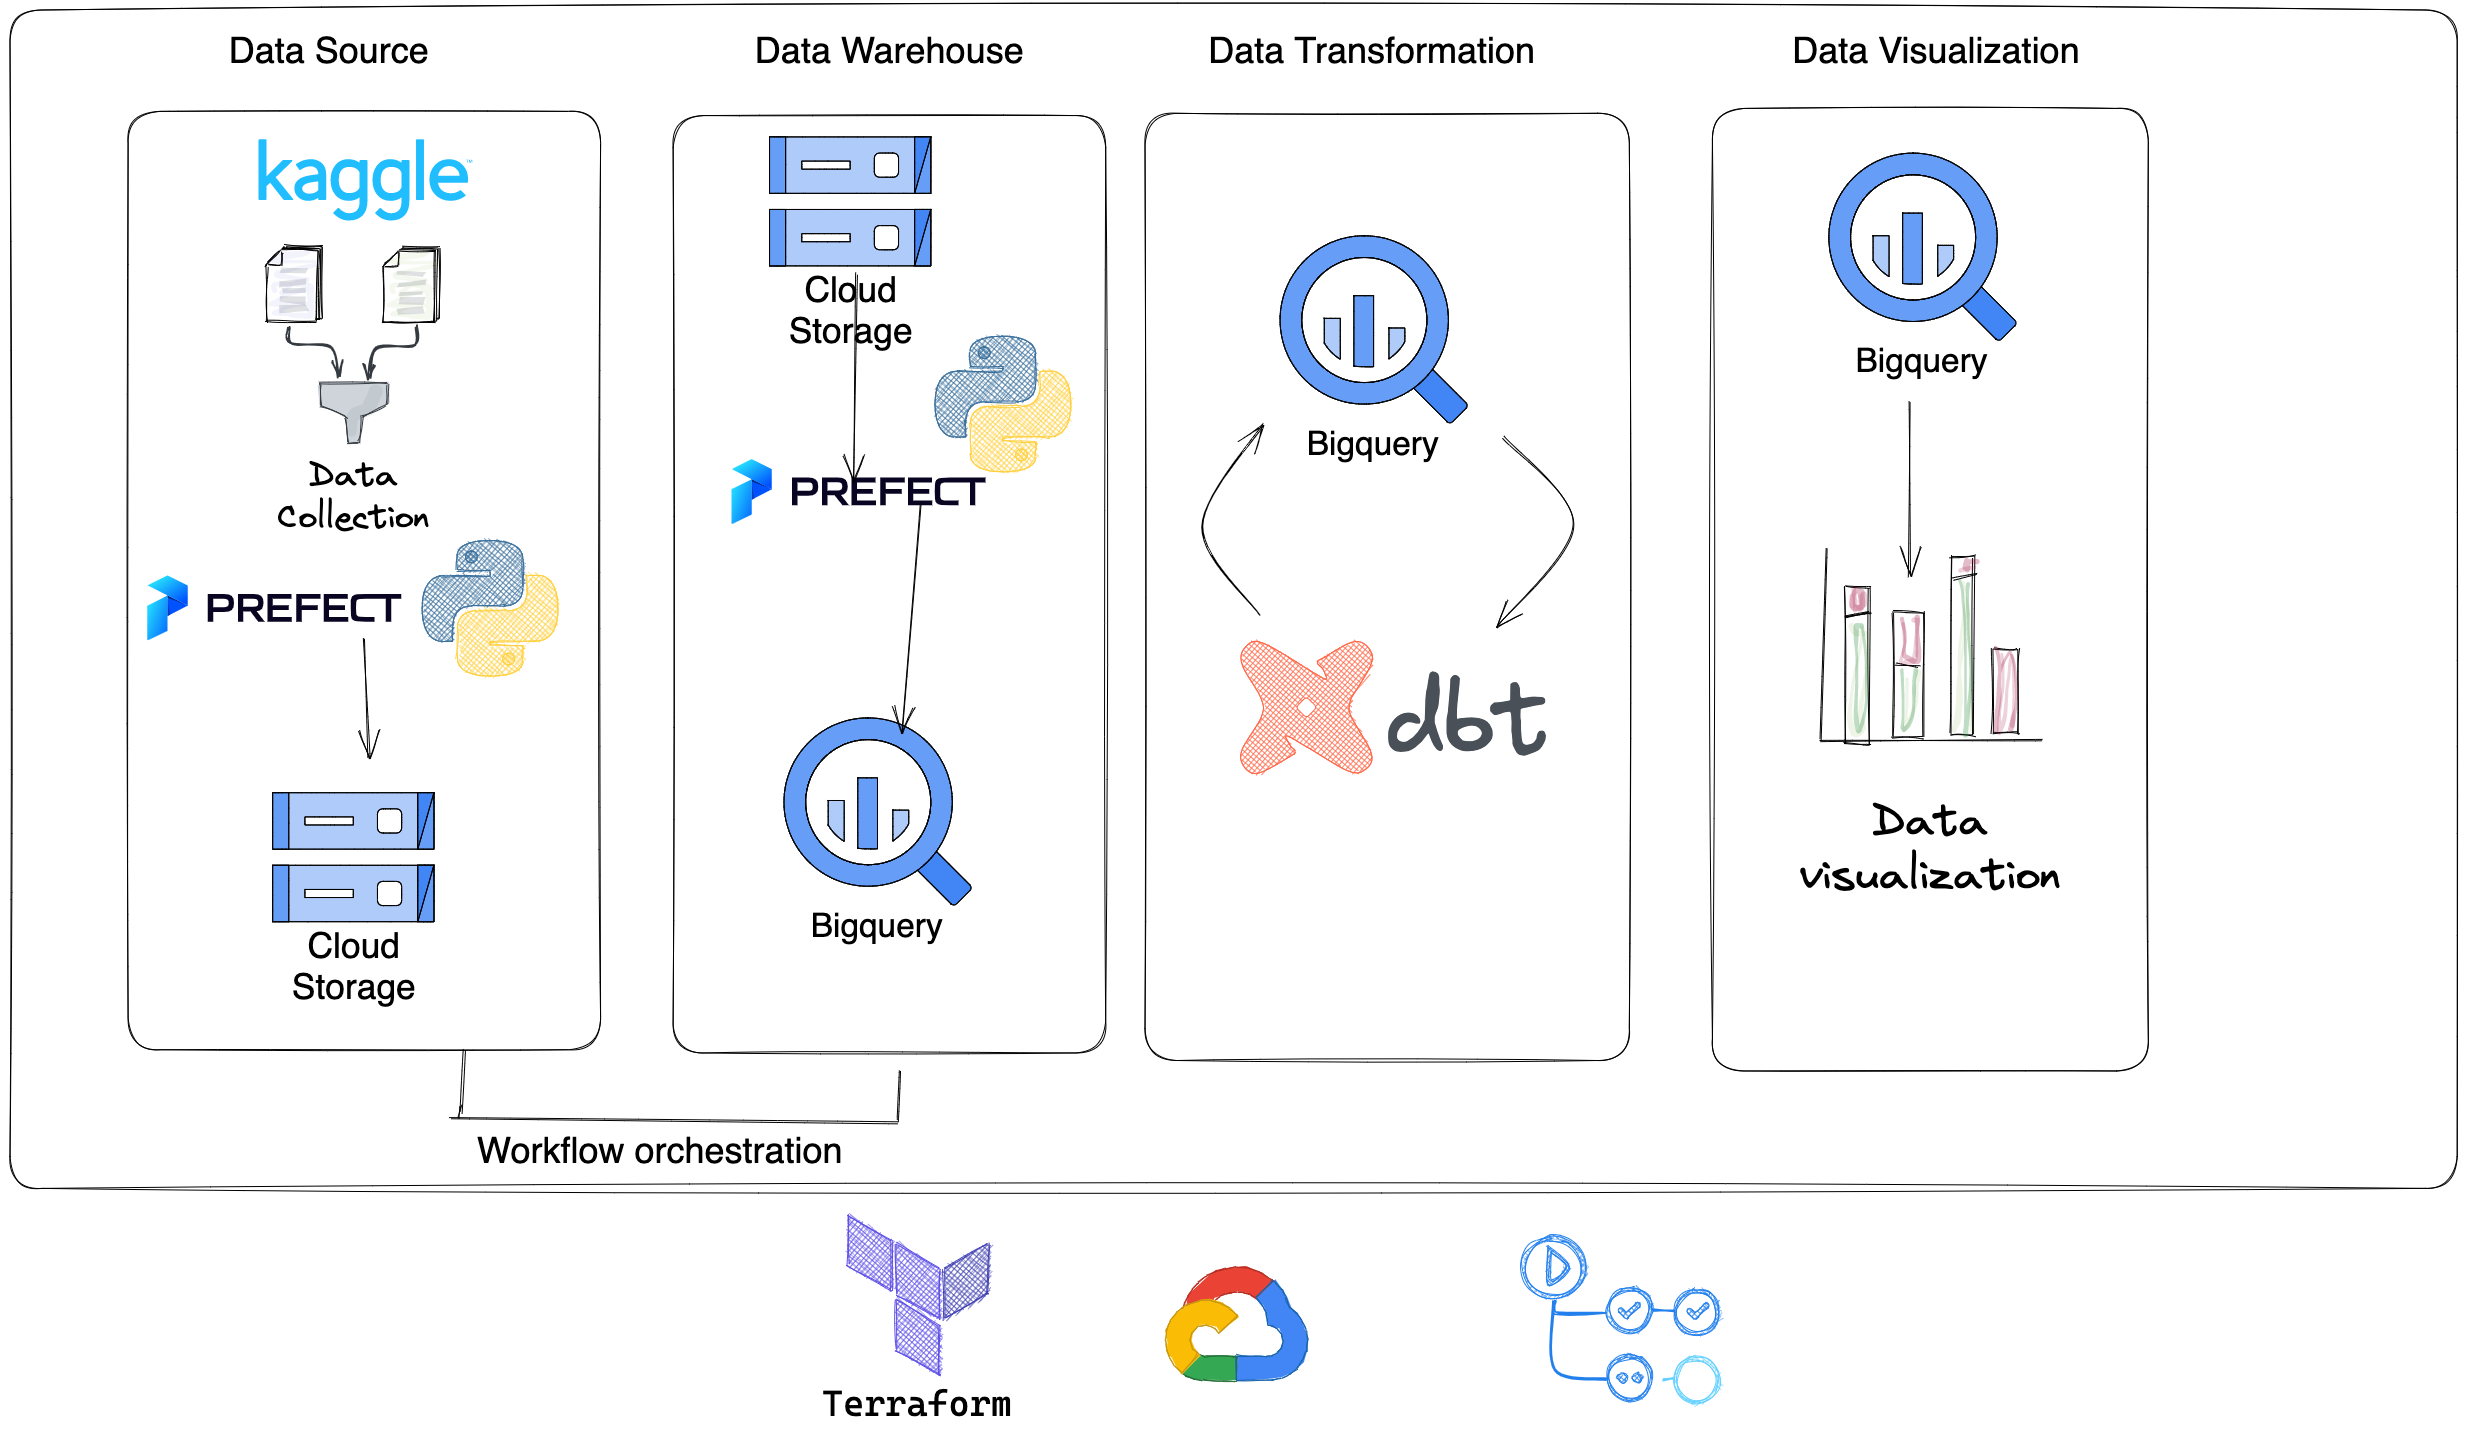
For my data engineering course project, I chose to utilize the Airline Delay and Cancellation Data, 2009 - 2018. The dataset is a summary information on the number of on-time, delayed, canceled, and diverted flights.
This dataset is not readily analyzable and there are few obstacles for data analysis, however. It has a few limitations, however. Firstly, it is divided into yearly segments spanning from 2009 to 2018. Additionally, the information is not easily extractable as there is little metadata. For example, the use of airline and airport codes may pose a challenge as there is no accompanying information within the dataset to identify these codes. To overcome this issue, I was able to source supplementary CSV files that contain details on each airport’s location, state, city and corresponding airport code.
This repository has a typical data processing workflow structure, consisting of infrastructure as code (Terraform), raw data in CSV format, processed data in parquet format, and data processing scripts in the processing folder. It also includes lookup tables for airline and airport codes in the data folder.
terraform: folder that contains Terraform configurations
terraform/main.tf: includes terraform for Google Cloud image
terraform/variable.tf: includes terraform variables for Google Cloud image
/data/csv: the raw data after downloading it from Kaggle
data/parquet: parquet files
data/: includes lookup tables for airline and airports codes
processing/flow: folder that contains transform and uploading raw data from local to Google Cloud Bucket then from Bucket to Google Cloud
DHW Queries for Partitioning and Clustering
-
Download the dataset from Airline Delay and Cancellation Data, 2009 - 2018
-
Move the dataset to
data/csvfolder in the code -
Run the Python Script
processing/flow/etl_to_gcs.pypython ./processing/flow/etl_to_gcs.py
-
Run the python Script
processing/flow/etl_gcs_to_bq.pypython ./processing/flow/etl_gcs_to_bq.py
-
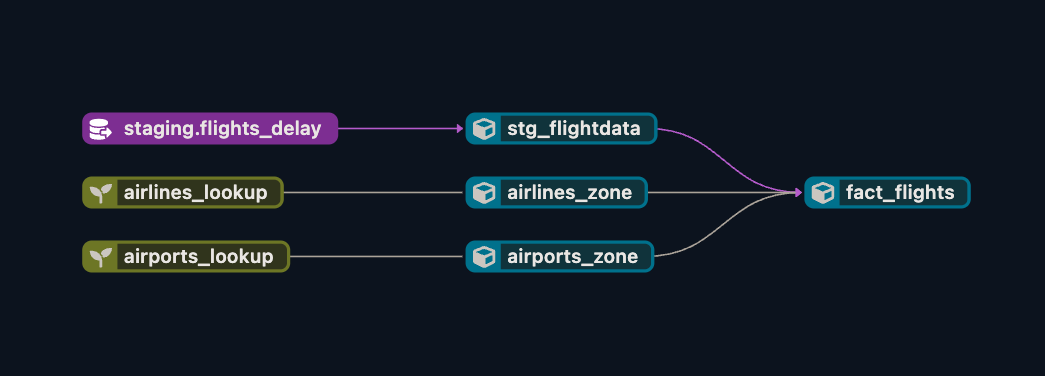
You can find the dbt files in second the branch called
dbt-model -
Go to your Google data studio and connect your BigQuery with the Dashboard Studio
-
You can find BigQuery Queries for partitioning and clustering in code
CREATE TABLE data-engineering-camp-376112.us_airline_delay.flights_delay_partitioned
PARTITION BY FL_DATE
CLUSTER BY OP_CARRIER, ORIGIN, DEST
OPTIONS(
expiration_timestamp=TIMESTAMP_ADD(CURRENT_TIMESTAMP(), INTERVAL 30 DAY),
description='My partitioned and clustered table'
) AS
SELECT *
FROM data-engineering-camp-376112.us_airline_delay.flights_delay;
CREATE TABLE data-engineering-camp-376112.us_airline_delay.flights_delay_clustered
PARTITION BY FL_DATE
CLUSTER BY OP_CARRIER
OPTIONS(
expiration_timestamp=TIMESTAMP_ADD(CURRENT_TIMESTAMP(), INTERVAL 30 DAY),
description='My partitioned and clustered table'
) AS
SELECT *
FROM data-engineering-camp-376112.us_airline_delay.flights_delay_partitioned;
https://cloud.getdbt.com/accounts/148444/runs/138771363/docs/#!/overview
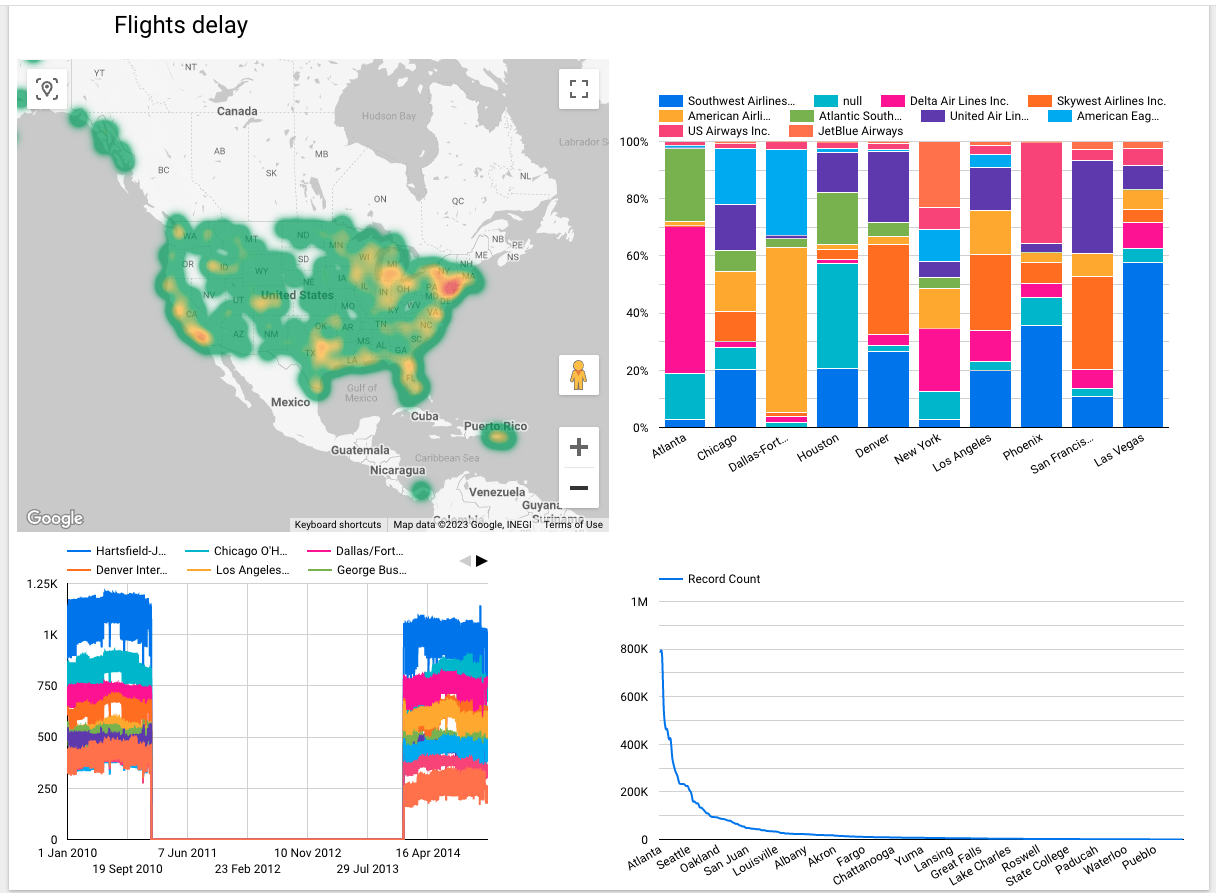
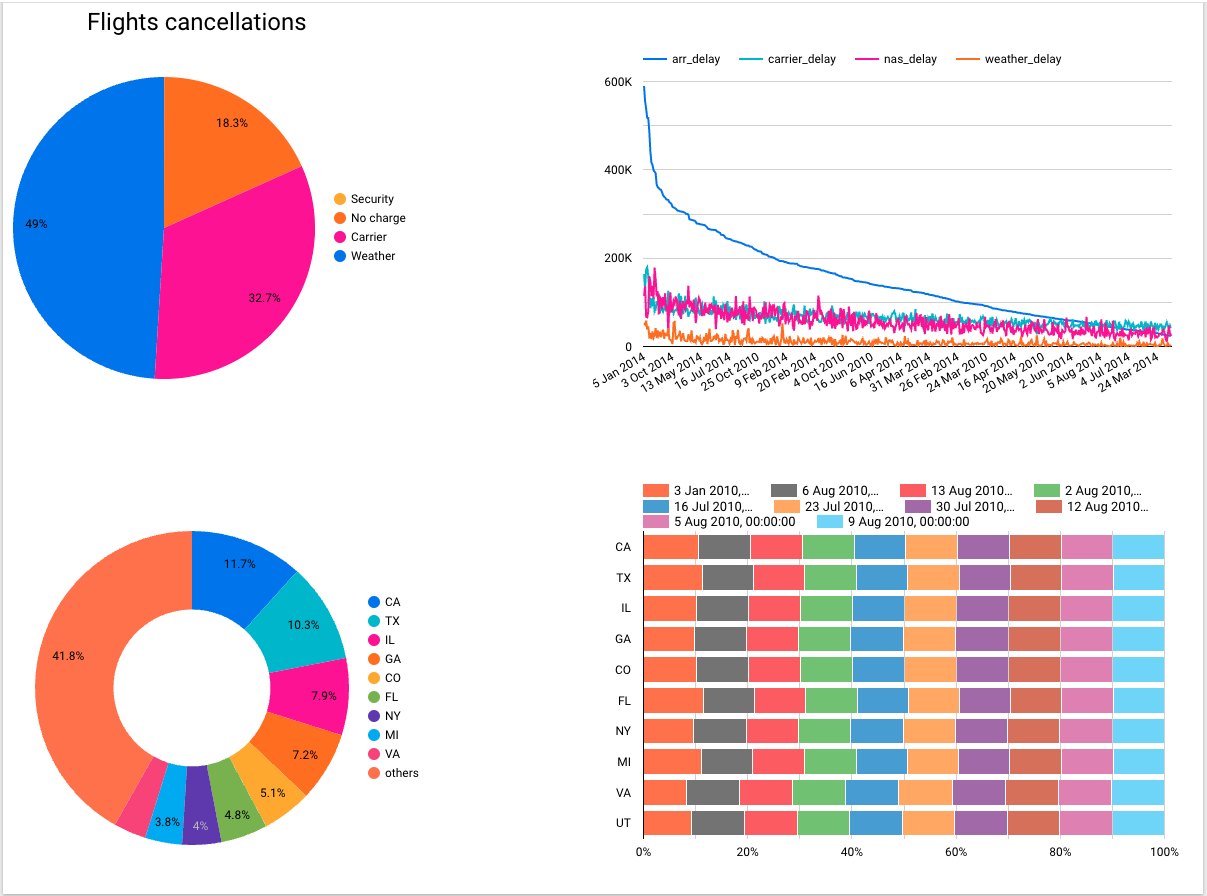
The Visualization section showcases a collection of charts that are designed to visually represent flight delay and cancellation data.
If you have any questions, feedback, or issues with the repository, please feel free to reach out to us using the following channels:
- Email: [email protected]
- LinkedIn: Shaalan Marwan
- GitHub Issue: https://github.com/ShaalanMarwan/airline-delay-and-cancellation/issues


