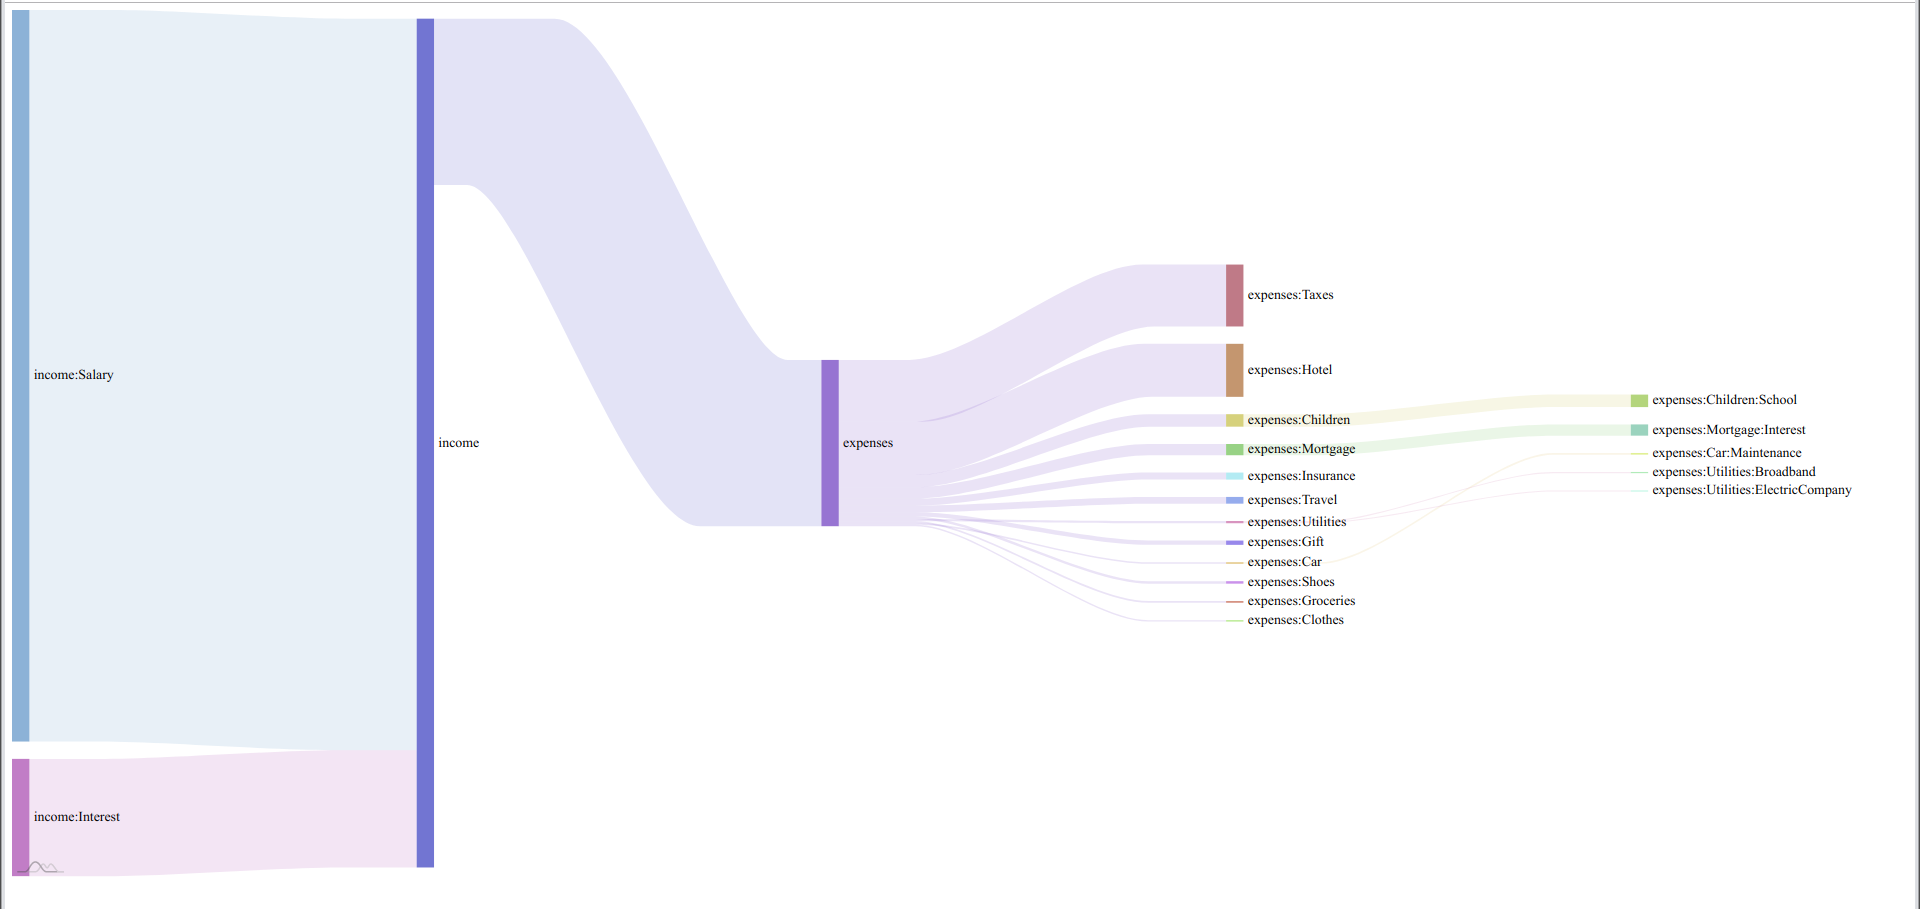
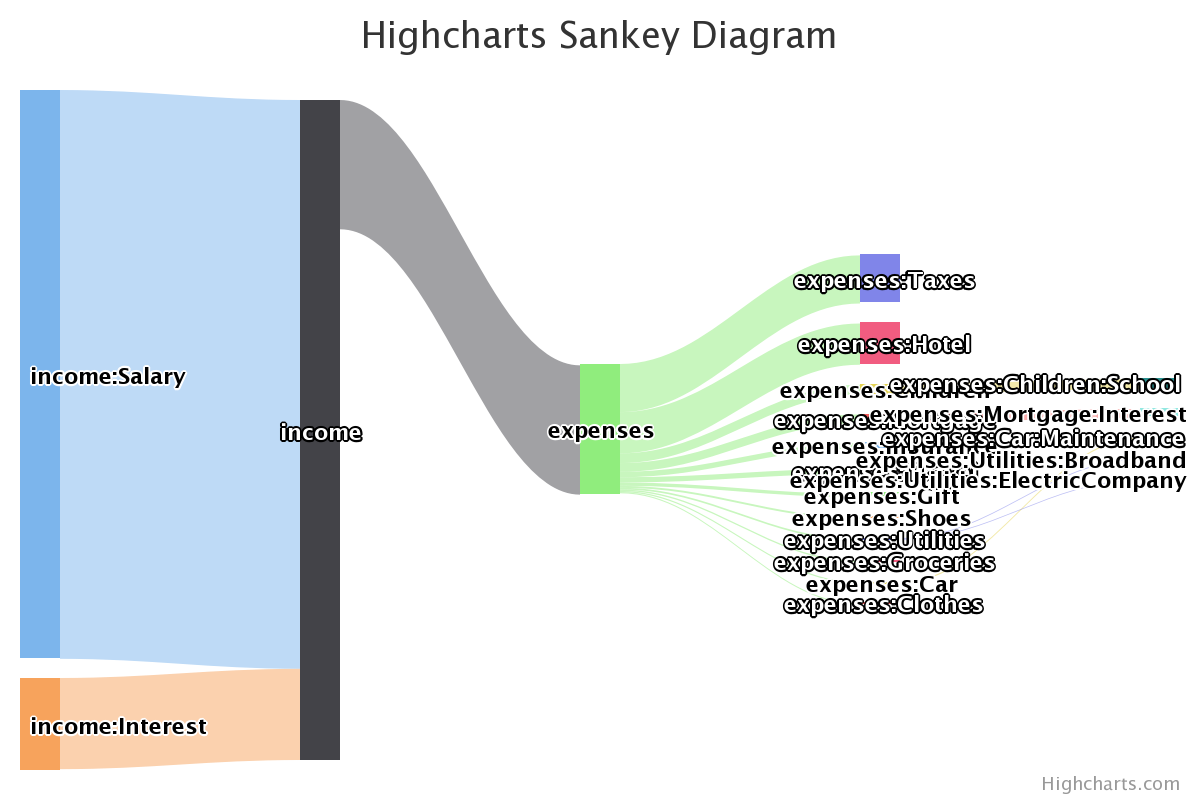
Script + html files to plot income vs expense money flows from hledger ledger as Sankey diagram
This is a proof of concept that I hacked in a hurry to see if this could be done and to compare different JavaScript implementations of Sankey plotters.
Run ./sankey.sh /path/to/your.ledger, which will generate sankey.csv in the html subdirectory.
Copy whole html subdirectory so that it is accessible over http(s). Open supplied html files and see the graphs.
NB: opening files locally (via file:// protocol) will not work! Csv data will not be fetched and you will not see graphs.
Repository contains sankey.csv generated out of slighly edited Cody.journal from hledger examples.
Script makes a bunch of assumptions:
-
bashor sufficiently compatible shell -
hledger,sedandawkare in your path -
your commodity symbols are
$or£ -
your income and expenses account hierarchies are called just that --
incomeandexpenses -
accounts with balances less than 50 will be ignored
-
incomestatementreport will be generated in cost basis (with--costargument)
If these assumptions do not hold for you, edit the script.
I personally hink that amscharts and highcharts yield the best results. Here is rendering of the sample file

