Josaiah Clark
BME 450, Abadi
3/11/20
CODE: https://colab.research.google.com/drive/161-dOmloFs4CqVRI5MB-9r4blUs_owjX
Power spectral density is a measurement of how power from a signal or ambient noise is distributed amongst a range of frequencies. In part 1, Power Spectral Density versus Frequency graphs were constructed to examine the effects of the following weather conditions on underwater noise: windy and rainy, rainy but not windy, windy but not windy, and neither windy nor rainy. Data was also contrasted between the Oregon Shelf Surface Mooring site and the Oregon Offshore Surface Mooring site to determine if wind and rain had different effects on underwater noise depending on location.
Spectrograms use color maps to visualize the most intense frequency components of a noise over time. In part 2, spectrograms were used to compare bandwidth, intensity, and duration for marine mammal vocalization, airgun noise, and seismic activity due to a volcanic eruption. Bandwidths for each signal were also compared to estimated ranges given by the Wenz curve, the standard reference for frequency ranges of many man-made and naturally occuring noises.
| Windy and Rainy | 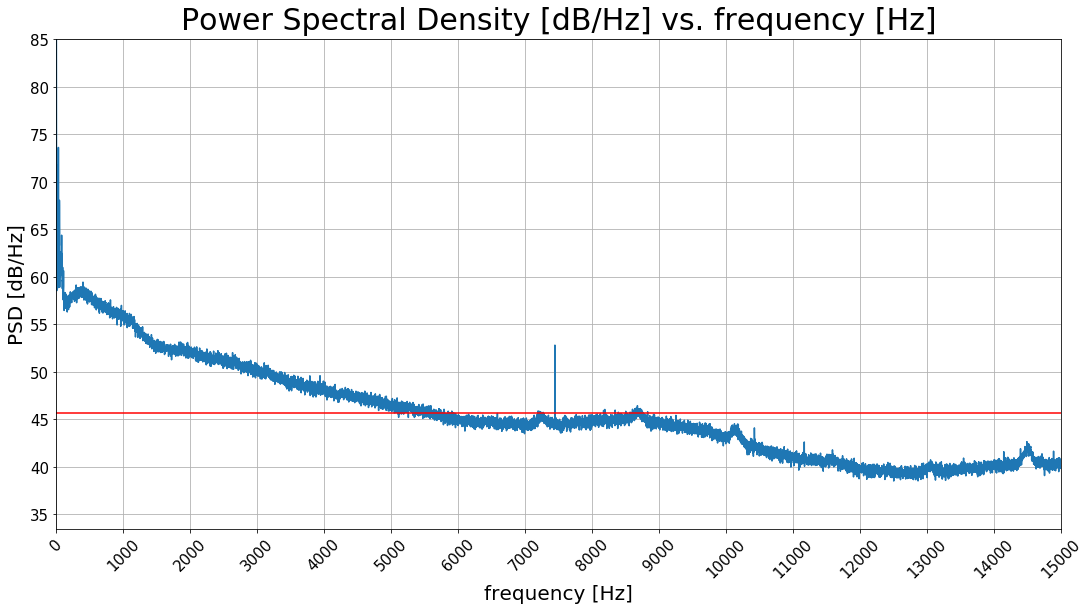 Figure 1 |
| Rainy, but not windy |  Figure 2 |
| Windy, but not rainy | 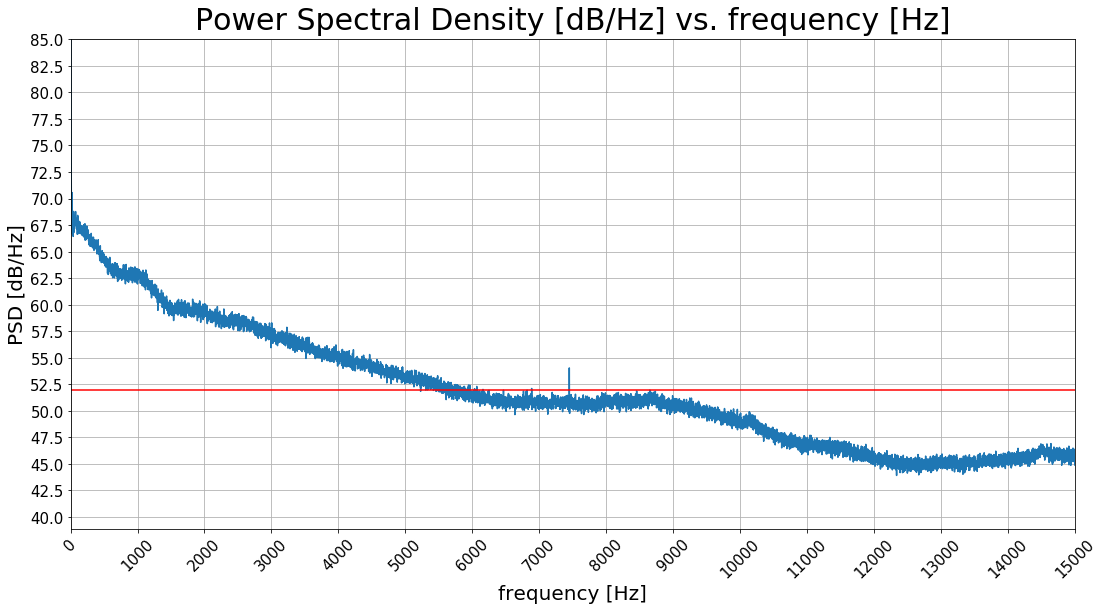 Figure 3 |
| Not windy and not rainy | 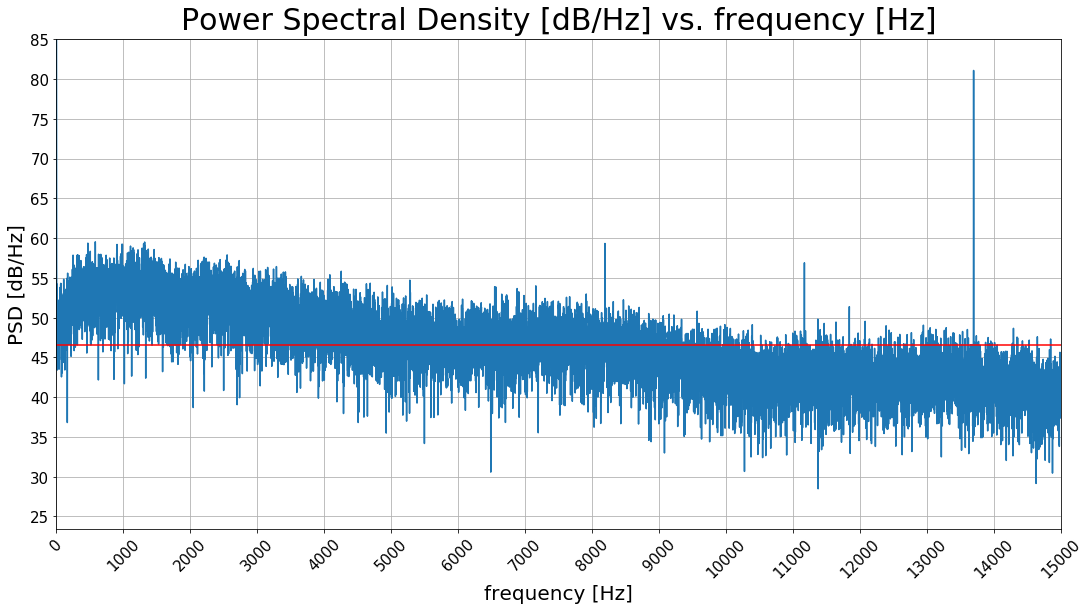 Figure 4 |
| Windy and Rainy |  Figure 5 |
| Rainy, but not windy | 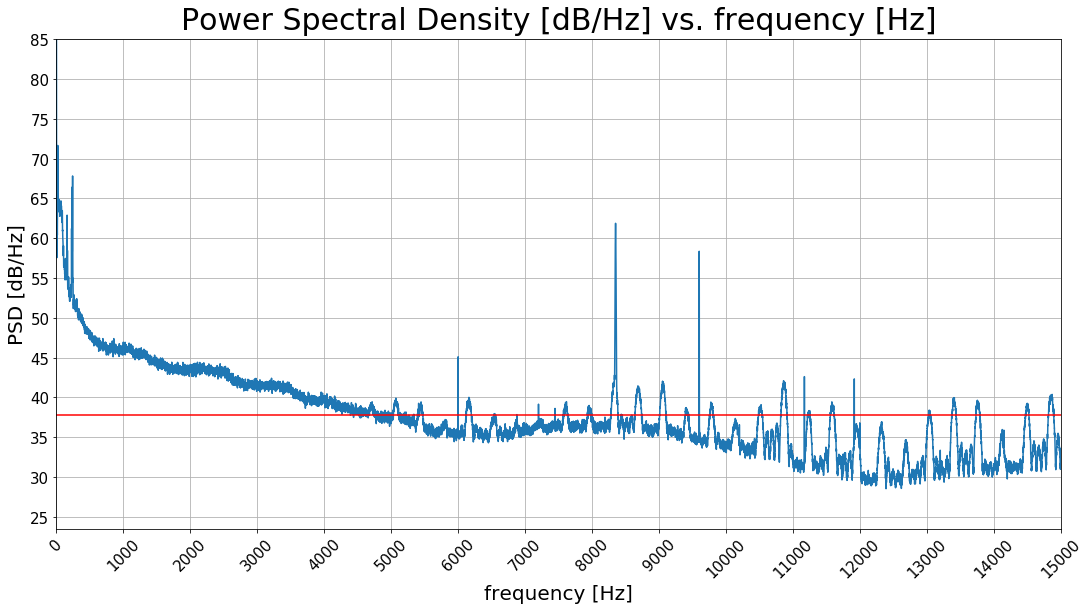 Figure 6 |
| Windy, but not rainy |  Figure 7 |
| Not windy and not rainy |  Figure 8 |
At the Oregon Shelf Surface Mooring site, the sound intensities for each weather condition are:
- Windy and Rainy: Peak 74 dB/Hz, average 45.5 dB/Hz (Figure 1)
- Rainy, but not windy: Peak 82 dB/Hz, average 55 dB/Hz (Figure 2)
- Windy, but not rainy: Peak 71 dB/Hz, 52 dB/Hz (Figure 3)
- Not windy and not rainy: Peak 60 dB/Hz, average 47 dB/Hz (Figure 4)
At the Oregon Offshore Surface Mooring site, the peak sound intensities for each weather condition are:
- Windy and Rainy: Peak 92 dB/Hz, average 42 dB/Hz (Figure 5)
- Rainy, but not windy: Peak 72 dB/Hz, average 38 dB/Hz (Figure 6)
- Windy, but not rainy: Peak 72 dB/Hz, average 44 dB/Hz (Figure 7)
- Not windy and not rainy: Peak 70 dB/Hz, average 50 dB/Hz (Figure 8)
At both locations, peak PSD levels were lowest in the absence of wind and rain. The average PSD levels, shown in each plot by a red line, still remained comparable to that of the other three weather conditions. Notably, in figure 4 there is a peak PSD of 82 dB/Hz at ~13,800 Hz, but it is unclear whether this is due to the weather or not. At the Oregon Shelf Surface Mooring site, rainy but not windy conditions clearly had the greatest effect on underwater noise, with peak and average levels exceeding all other conditions. At the Oregon Offshore Surface Mooring site, the highest peak was achieved during both windy and rainy conditions, withg the highest average level occuring during not windy and not rainy conditions. Thus, at this site both windy and rainy conditions had the greatest effect on underwater noise.
In all cases, wind and rain increased PSD levels at very low frequencies, with decreasing influence on PSD levels at higher ones. The Oregon Shelf Surface Mooring site recorded peak PSD levels 10 dB/Hz higher than equivalent conditions at the Oregon Offshore Surface Mooring site, while the peak PSD level at the offshore site during windy and rainy conditions was 18 dB/Hz higher than the shelf site. Windy but not rainy PSD levels were nearly equal at both sites, and the offshore surface mooring site recorded peak PSD levels 10 dB/Hz higher than the shelf surface mooring site.
| Marine Mammal Vocalization | 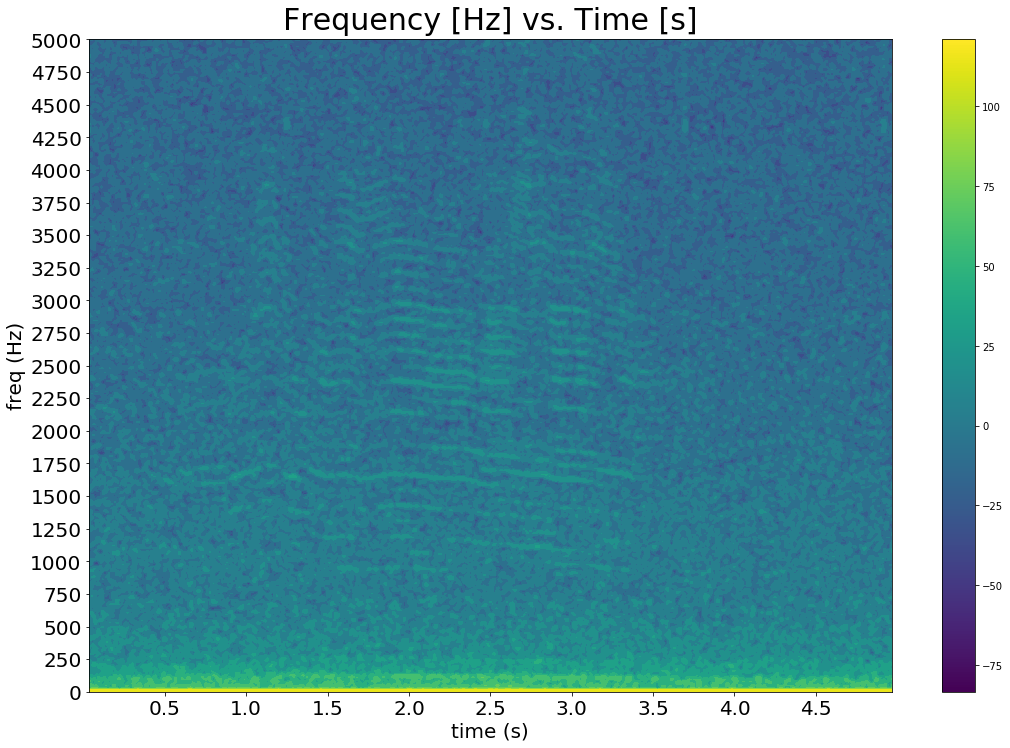 Figure 9 |
| Airgun Noise | 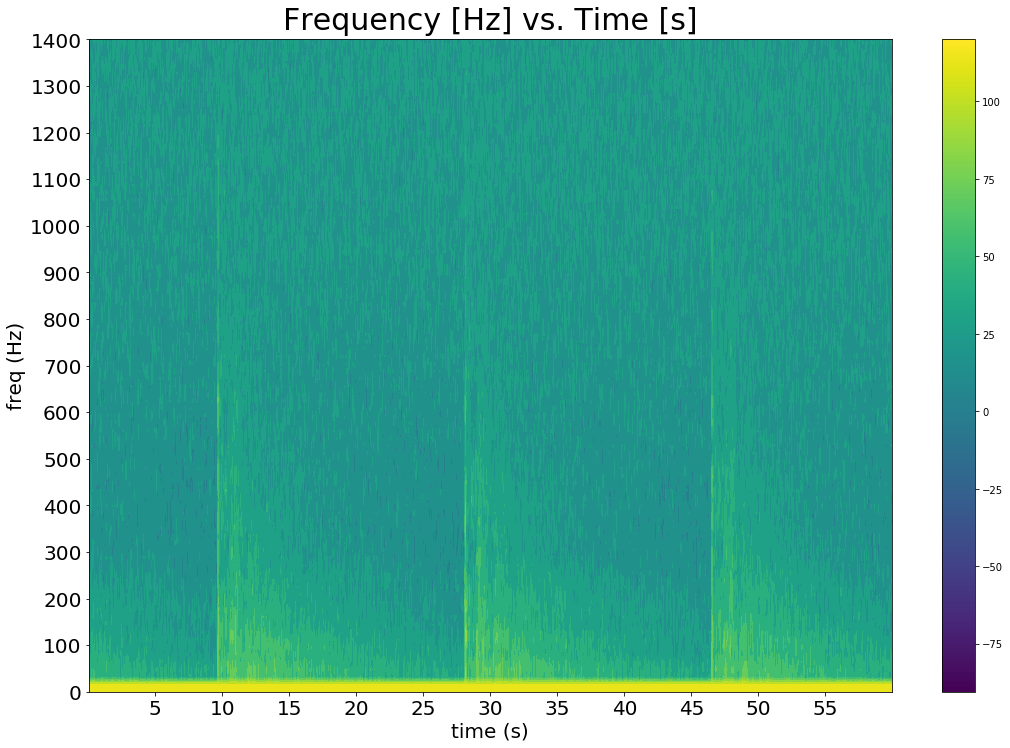 Figure 10 |
| Axial Seamount Earthquake after volcanic eruption | 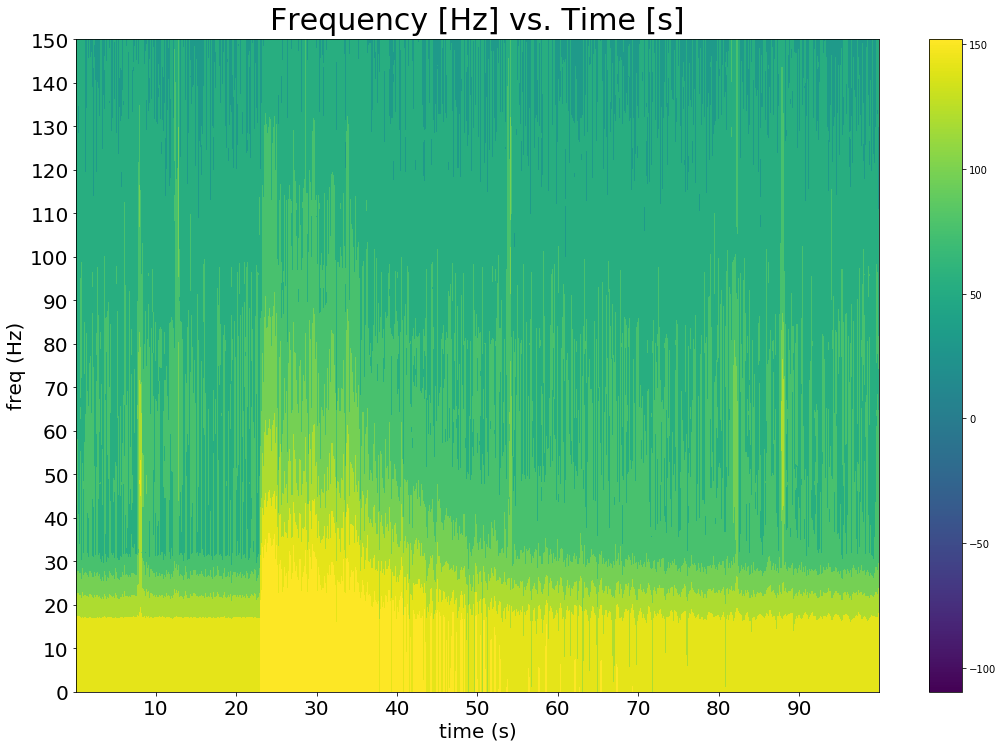 Figure 11 |
In figure 9, the marine mammal vocalization signal appears to be composed of a wide range of sinusoidal frequency components ranging from 750-4500 Hertz; this is in agreement with the Wentz curve's 10- >100,000 Hz. The signal's duration is about four seconds, and its maximum intensity is around 80 dB.
Figure 10 shows a series of three airgun shots, all within 0-1200 Hz. Airgun noises are created by bubbles, and the Wenz curve states that bubble noises are in the frequency range of 100 to approximately 20,000 Hz, which encapsulates much of the frequency range of this signal. The airgun signals are periodic, occuring about eighteen seconds apart and lasting 5-10 seconds. Each airgun noise has a maximum intensity of around 105 dB.
The seismic activity shown in figure 11 has a max frequency of ~130 Hz, which is close to the Wenz curve's range of 0-100 Hz. The primary signal has an intensity of around 150 dB, lasting almost 70 seconds.
Closer to the coast at the Oregon Shelf Surface Mooring site, rain appears to have a greater effect than wind on underwater noise. Further away from the coast at the Oregon Offshore Surface Mooring site, neither wind nor rain have a greater effect on underwater noise, but there is consistently higher peak PSD levels on calm time periods where there is no wind or rain and time periods where there is combined wind and rain. Differences in spectral levels at the Oregon shelf location versus the ORegon offshore location could be due to wind dampening closer to shore, or more intense storms at the offshore site in addition to higher day-to-day average wind speed. At either site, both wind and rain contribute to higher underwater noise levels.
The three observed noises in part 2- marine mammal vocalization, airgun noise, and seismic activity- were found to be close to ranges given by the Wenz curve. Marine mammal vocalization on the Wenz curve covers a broad range of frequencies, and the recorded signal easily fell within the expected 10-100,000+ Hz range. The recorded seismic signal had peak frequencies 30 Hz higher than expected; the shape of the wave shows a dominant frequency component peaking at about 35 Hz, and four elongated 'copies' of the waveform at higher frequencies. Even if these signal copies were part of the original seismic signal, the majority of the signal's energy definitely lied within 0-100 Hz. Airgun noise is not marked on the Wenz curve, but since its primary sound is produced by bubbles, it makes sense that the observed signal's range of 0-1200 Hz was almost entirely within the 100-100,000 Hz range of bubble noise shown on the Wenz curve. The 0-100 Hz of the airgun noise not accounted for by bubble noise frequency range is attributable to the low frequency range of explosions; airguns are acoustically similar to explosions in that there is a shockwave released by both upon activation.