


An interactive NVIDIA-GPU process viewer, the one-stop solution for GPU process management. (screenshots)
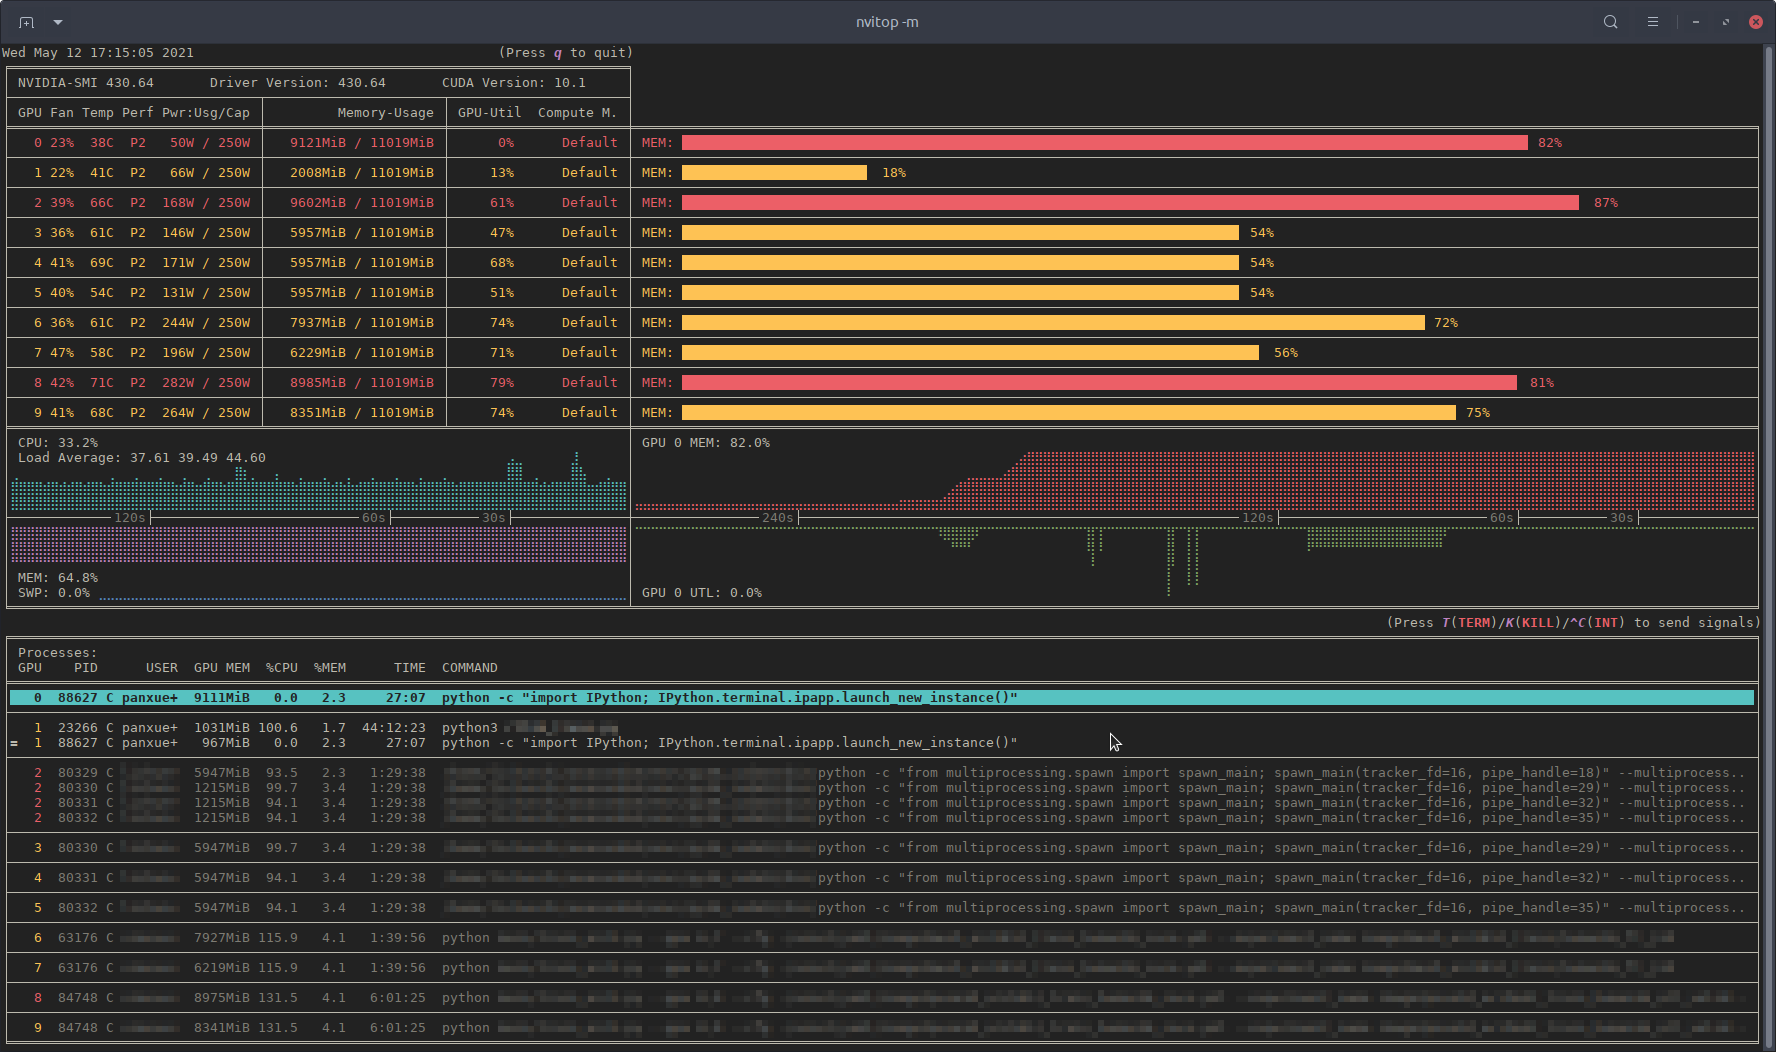
Monitor mode of nvitop.
(TERM: GNOME Terminal / OS: Ubuntu 16.04 LTS (over SSH) / Locale: en_US.UTF-8)
- Features
- Requirements
- Installation
- Usage
- Screenshots
- License
- TODO List
This project is inspired by nvidia-htop and nvtop for monitoring, and gpustat for application integration.
nvidia-htop is a tool for enriching the output of nvidia-smi. It uses regular expressions to read the output of nvidia-smi from a subprocess, which is inefficient. In the meanwhile, there is a powerful interactive GPU monitoring tool called nvtop. But nvtop is written in C, which makes it lack of portability. And what is really inconvenient is that you should compile it yourself during the installation. Therefore, I made this repo. I got a lot help when reading the source code of ranger, the console file manager. Some files in this repo are modified from ranger under the GPLv3 License.
If this repo is useful to you, please star ⭐️ it to let more people know 🤗.

Compare to nvidia-smi.
- Informative and fancy output: show more information than
nvidia-smiwith colorized fancy box drawing. - Monitor mode: can run as a resource monitor, rather than print the results only once. (vs. nvidia-htop, limited support with command
watch -c)- bar plots and history graphs
- process sorting
- process filtering
- send signals to processes with a keystroke
- tree-view screen for GPU processes and their parent processes
- environment variable screen
- help screen
- mouse support
- Interactive: responsive for user input (from keyboard and/or mouse) in monitor mode. (vs. gpustat & py3nvml)
- Efficient:
- query device status using NVML Python bindings directly, instead of parsing the output of
nvidia-smi. (vs. nvidia-htop) - cache results with
TTLCachefrom cachetools. (vs. gpustat) - display information using the
curseslibrary rather thanprintwith ANSI escape codes. (vs. py3nvml) - asynchronously gather information using multi-threading and correspond to user input much faster. (vs. nvtop)
- query device status using NVML Python bindings directly, instead of parsing the output of
- Portable: work on both Linux and Windows.
- get host process information using the cross-platform library psutil instead of calling
ps -p <pid>in a subprocess. (vs. nvidia-htop & py3nvml) - written in pure Python, easy to install with
pip. (vs. nvtop)
- get host process information using the cross-platform library psutil instead of calling
- Integrable: easy to integrate into other applications, more than monitoring. (vs. nvidia-htop & nvtop)

nvitop supports Windows!
(SHELL: PowerShell / TERM: Windows Terminal / OS: Windows 10 / Locale: en-US)
- Python 3.5+ (with
pip>=10.0) - NVIDIA Management Library (NVML)
- nvidia-ml-py
- psutil
- cachetools
- termcolor
- curses* (with
libncursesw)
NOTE: The NVIDIA Management Library (NVML) is a C-based programmatic interface for monitoring and managing various states. The runtime version of NVML library ships with the NVIDIA display driver (available at Download Drivers | NVIDIA), or can be downloaded as part of the NVIDIA CUDA Toolkit (available at CUDA Toolkit | NVIDIA Developer). The lists of OS platforms and NVIDIA-GPUs supported by the NVML library can be found in the NVML API Reference.
* The curses library is a built-in module of Python on Unix-like systems, and it is supported by a third-party package called windows-curses on Windows using PDCurses. Inconsistent behavior of nvitop may occur on different terminal emulators on Windows, such as missing mouse support.
Install from PyPI (
pip3 install --upgrade nvitopInstall the latest version from GitHub (
pip3 install git+https://github.com/XuehaiPan/nvitop.git#egg=nvitopOr, clone this repo and install manually:
git clone --depth=1 https://github.com/XuehaiPan/nvitop.git
cd nvitop
pip3 install .
NOTE: If you encounter the "nvitop: command not found" error after installation, please check whether you have added the Python console script path (e.g., "${HOME}/.local/bin") to your PATH environment variable. Alternatively, you can use python3 -m nvitop.
IMPORTANT: pip will install nvidia-ml-py==11.450.51 as a dependency for nvitop. Please verify whether the nvidia-ml-py package is compatible with your NVIDIA driver version. You can check the release history of nvidia-ml-py at nvidia-ml-py's Release History, and install the compatible version manually by:
pip3 install --no-dependencies nvidia-ml-py==xx.yyy.zzzSince nvidia-ml-py>=11.450.129, the definition of nvmlProcessInfo_t has introduced two new fields gpuInstanceId and computeInstanceId (GI ID and CI ID in newer nvidia-smi) which are incompatible with some old NVIDIA drivers. nvitop may not display the processes correctly due to this incompatibility.
Query the device and process status. The output is similar to nvidia-smi, but has been enriched and colorized.
# Query status of all devices
$ nvitop -1  # or use `python3 -m nvitop -1`

# Specify query devices (by integer indices)
$ nvitop -1 -o 0 1  # only show <GPU 0> and <GPU 1>

# Only show devices in `CUDA_VISIBLE_DEVICES` (by integer indices or UUID strings)
$ nvitop -1 -ov

# Only show GPU processes with the compute context (type: 'C' or 'C+G')
$ nvitop -1 -c
When the -1 switch is on, the result will be displayed ONLY ONCE (same as the default behavior of nvidia-smi). This is much faster and has lower resource usage. You can omit the -1 option by setting the environment variable NVITOP_MONITOR_ALWAYS=false to have this behavior by default. See Command Line Options for more command options.
Run as a resource monitor:
# Monitor mode (when the display mode is omitted, `NVITOP_MONITOR_MODE` will be used)
$ nvitop  # or use `python3 -m nvitop`

# Automatically configure the display mode according to the terminal size
$ nvitop -m auto     # shortcut: `a` key

# Arbitrarily display as `full` mode
$ nvitop -m full     # shortcut: `f` key

# Arbitrarily display as `compact` mode
$ nvitop -m compact  # shortcut: `c` key

# Specify query devices (by integer indices)
$ nvitop -o 0 1  # only show <GPU 0> and <GPU 1>

# Only show devices in `CUDA_VISIBLE_DEVICES` (by integer indices or UUID strings)
$ nvitop -ov

# Only show GPU processes with the compute context (type: 'C' or 'C+G')
$ nvitop -c

# Use ASCII characters only
$ nvitop -U  # useful for terminals without Unicode support

# For light terminals
$ nvitop --light
You can configure the default monitor mode with the environment variable NVITOP_MONITOR_MODE (default auto if not set). See Command Line Options and Environment Variables for more command options.
Press h for help or q to return to the terminal. See Keybindings for Monitor Mode for more shortcuts.

nvitop comes with a help screen (shortcut: h).
In monitor mode, you can use Ctrl-c / T / K keys to interrupt / terminate / kill a process. And it's recommended to terminate or kill a process in the tree-view screen (shortcut: t). For normal users, nvitop will shallow other users' processes (in low-intensity colors). For system administrators, you can use sudo nvitop to terminate other users' processes.
Build and run the Docker image using nvidia-docker:
git clone --depth=1 https://github.com/XuehaiPan/nvitop.git && cd nvitop  # clone this repo first
docker build --tag nvitop:latest .  # build the Docker image
docker run -it --rm --runtime=nvidia --gpus=all --pid=host nvitop:latest  # run the Docker container
The Dockerfile has a optional build argument basetag (default: 418.87.01-ubuntu18.04) for the tag of image nvidia/driver.
NOTE: Don't forget to add the --pid=host option when running the container.
Run nvitop directly on the SSH session instead of a login shell:
ssh user@host -t nvitop                 # installed by `sudo pip3 install ...`
ssh user@host -t '~/.local/bin/nvitop'  # installed by `pip3 install --user ...`
NOTE: Users need to add the -t option to allocate a pseudo-terminal over the SSH session for monitor mode.
Type nvitop --help for more command options:
usage: nvitop [--help] [--version] [--once] [--monitor [{auto,full,compact}]]
              [--ascii] [--force-color] [--light] [--gpu-util-thresh th1 th2]
              [--mem-util-thresh th1 th2] [--only idx [idx ...]]
              [--only-visible] [--compute] [--graphics]
              [--user [USERNAME ...]] [--pid PID [PID ...]]

An interactive NVIDIA-GPU process viewer.

optional arguments:
  --help, -h            Show this help message and exit.
  --version, -V         Show nvitop's version number and exit.
  --once, -1            Report query data only once.
  --monitor [{auto,full,compact}], -m [{auto,full,compact}]
                        Run as a resource monitor. Continuously report query data and handle user inputs.
                        If the argument is omitted, the value from `NVITOP_MONITOR_MODE` will be used.
                        (default fallback mode: auto)
  --ascii, --no-unicode, -U
                        Use ASCII characters only, which is useful for terminals without Unicode support.

coloring:
  --force-color         Force colorize even when `stdout` is not a TTY terminal.
  --light               Tweak visual results for light theme terminals in monitor mode.
                        Set variable `NVITOP_MONITOR_THEME="light"` on light terminals for convenience.
  --gpu-util-thresh th1 th2
                        Thresholds of GPU utilization to determine the load intensity.
                        Coloring rules: light < th1 % <= moderate < th2 % <= heavy.
                        ( 1 <= th1 < th2 <= 99, defaults: 10 75 )
  --mem-util-thresh th1 th2
                        Thresholds of GPU memory percent to determine the load intensity.
                        Coloring rules: light < th1 % <= moderate < th2 % <= heavy.
                        ( 1 <= th1 < th2 <= 99, defaults: 10 80 )

device filtering:
  --only idx [idx ...], -o idx [idx ...]
                        Only show the specified devices, suppress option `--only-visible`.
  --only-visible, -ov   Only show devices in environment variable `CUDA_VISIBLE_DEVICES`.

process filtering:
  --compute, -c         Only show GPU processes with the compute context. (type: 'C' or 'C+G')
  --graphics, -g        Only show GPU processes with the graphics context. (type: 'G' or 'C+G')
  --user [USERNAME ...], -u [USERNAME ...]
                        Only show processes of the given users (or `$USER` for no argument).
  --pid PID [PID ...], -p PID [PID ...]
                        Only show processes of the given PIDs.
nvitop can accept the following environment variables for monitor mode:
| Name | Description | Valid Values | Fallback Value |
|---|---|---|---|
NVITOP_MONITOR_ALWAYS |
Always invoke the monitor mode | true / yes / on / 1false / no / off / 0 |
true |
NVITOP_MONITOR_MODE |
The default display mode | auto / full / compact |
auto |
NVITOP_MONITOR_THEME |
The default color theme | dark / light |
dark |
NVITOP_GPU_UTILIZATION_THRESHOLDS |
Thresholds of GPU utilization | 10,75 , 1,99, ... |
10,75 |
NVITOP_MEMORY_UTILIZATION_THRESHOLDS |
Thresholds of GPU memory percent | 10,80 , 1,99, ... |
10,80 |
For example:
# Replace the following export statements if you are not using Bash / Zsh
export NVITOP_MONITOR_ALWAYS="true"
export NVITOP_MONITOR_MODE="full"
export NVITOP_MONITOR_THEME="light"

# Full monitor mode with light terminal tweaks
nvitop
For convenience, you can add these environment variables to your shell startup file, e.g.:
# For Bash
echo 'export NVITOP_MONITOR_MODE="full"' >> ~/.bashrc

# For Zsh
echo 'export NVITOP_MONITOR_MODE="full"' >> ~/.zshrc

# For Fish
echo 'set -gx NVITOP_MONITOR_MODE "full"' >> ~/.config/fish/config.fish

# For PowerShell
'$Env:NVITOP_MONITOR_MODE = "full"' >> $PROFILE.CurrentUserAllHosts| Key | Binding |
|---|---|
q |
Quit and return to the terminal. |
h / ? |
Go to the help screen. |
a / f / c |
Change the display mode to auto / full / compact. |
r / <C-r> / <F5> |
Force refresh the window. |
<Up> / <Down><A-k> / <A-j><Tab> / <S-Tab><Wheel> |
Select and highlight a process. |
<Left> / <Right><A-h> / <A-l><S-Wheel> |
Scroll the host information of processes. |
<Home> |
Select the first process. |
<End> |
Select the last process. |
<C-a>^ |
Scroll left to the beginning of the process entry (i.e. beginning of line). |
<C-e>$ |
Scroll right to the end of the process entry (i.e. end of line). |
<PageUp> / <PageDown><A-K> / <A-J>[ / ] |
scroll entire screen (for large amounts of processes). |
<Esc> |
Clear process selection. |
<C-c>I |
Send signal.SIGINT to the selected process (interrupt). |
T |
Send signal.SIGTERM to the selected process (terminate). |
K |
Send signal.SIGKILL to the selected process (kill). |
e |
Show process environment. |
t |
Toggle tree-view screen. |
, / . |
Select the sort column. |
/ |
Reverse the sort order. |
on (oN) |
Sort processes in the natural order, i.e., in ascending (descending) order of GPU. |
ou (oU) |
Sort processes by USER in ascending (descending) order. |
op (oP) |
Sort processes by PID in descending (ascending) order. |
og (oG) |
Sort processes by GPU-MEM in descending (ascending) order. |
os (oS) |
Sort processes by %SM in descending (ascending) order. |
oc (oC) |
Sort processes by %CPU in descending (ascending) order. |
om (oM) |
Sort processes by %MEM in descending (ascending) order. |
ot (oT) |
Sort processes by TIME in descending (ascending) order. |
HINT: It's recommended to terminate or kill a process in the tree-view screen (shortcut: t).
nvitop provides two builtin callbacks for TensorFlow (Keras) and PyTorch Lightning.
Callback for TensorFlow (Keras)
from tensorflow.python.keras.utils.multi_gpu_utils import multi_gpu_model
from tensorflow.python.keras.callbacks import TensorBoard
from nvitop.callbacks.keras import GpuStatsLogger
gpus = ['/gpu:0', '/gpu:1']  # or `gpus = [0, 1]` or `gpus = 2`
model = Xception(weights=None, ..)
model = multi_gpu_model(model, gpus)  # optional
model.compile(..)
tb_callback = TensorBoard(log_dir='./logs')  # or `keras.callbacks.CSVLogger`
gpu_stats = GpuStatsLogger(gpus)
model.fit(.., callbacks=[gpu_stats, tb_callback])
NOTE: Users should assign a keras.callbacks.TensorBoard callback or a keras.callbacks.CSVLogger callback to the model. And the GpuStatsLogger callback should be placed before the keras.callbacks.TensorBoard / keras.callbacks.CSVLogger callback.
Callback for PyTorch Lightning
from pytorch_lightning import Trainer
from nvitop.callbacks.lightning import GpuStatsLogger
gpu_stats = GpuStatsLogger()
trainer = Trainer(gpus=[..], logger=True, callbacks=[gpu_stats])
NOTE: Users should assign a logger to the trainer.
nvitop can be easily integrated into other applications. You can use nvitop to make your own monitoring tools.
In [1]: from nvitop import host, Device, PhysicalDevice, CudaDevice, HostProcess, GpuProcess, NA
   ...: import os
   ...: os.environ['CUDA_VISIBLE_DEVICES'] = '9,8,7,6'  # comma-separated integers or UUID strings

In [2]: Device.driver_version()
Out[2]: '430.64'

In [3]: Device.cuda_version()
Out[3]: '10.1'

In [4]: Device.count()
Out[4]: 10

In [5]: CudaDevice.count()
Out[5]: 4

In [6]: all_devices = Device.all()                 # all devices on board (physical device)
   ...: nvidia_0_1  = Device.from_indices([0, 1])  # from physical device indices
   ...: all_devices
Out[6]: [
    Device(index=0, name="GeForce RTX 2080 Ti", total_memory=11019MiB),
    Device(index=1, name="GeForce RTX 2080 Ti", total_memory=11019MiB),
    Device(index=2, name="GeForce RTX 2080 Ti", total_memory=11019MiB),
    Device(index=3, name="GeForce RTX 2080 Ti", total_memory=11019MiB),
    Device(index=4, name="GeForce RTX 2080 Ti", total_memory=11019MiB),
    Device(index=5, name="GeForce RTX 2080 Ti", total_memory=11019MiB),
    Device(index=6, name="GeForce RTX 2080 Ti", total_memory=11019MiB),
    Device(index=7, name="GeForce RTX 2080 Ti", total_memory=11019MiB),
    Device(index=8, name="GeForce RTX 2080 Ti", total_memory=11019MiB),
    Device(index=9, name="GeForce RTX 2080 Ti", total_memory=11019MiB)
]

In [7]: # NOTE: The function results might be different between calls when environment variable `CUDA_VISIBLE_DEVICES` has been modified
   ...: cuda_visible_devices = Device.from_cuda_visible_devices()  # from environment variable `CUDA_VISIBLE_DEVICES`
   ...: cuda_0_1             = Device.from_cuda_indices([0, 1])    # from CUDA device indices (might be different from physical device indices if `CUDA_VISIBLE_DEVICES` is set)
   ...: cuda_visible_devices = CudaDevice.all()                    # shortcut to `Device.from_cuda_visible_devices()`
   ...: cuda_visible_devices
Out[7]: [
    CudaDevice(cuda_index=0, physical_index=9, name="NVIDIA GeForce RTX 2080 Ti", total_memory=11019MiB),
    CudaDevice(cuda_index=1, physical_index=8, name="NVIDIA GeForce RTX 2080 Ti", total_memory=11019MiB),
    CudaDevice(cuda_index=2, physical_index=7, name="NVIDIA GeForce RTX 2080 Ti", total_memory=11019MiB),
    CudaDevice(cuda_index=3, physical_index=6, name="NVIDIA GeForce RTX 2080 Ti", total_memory=11019MiB)
]

In [8]: nvidia0 = Device(0)  # from device index (or `Device(index=0)`)
   ...: nvidia0
Out[8]: Device(index=0, name="GeForce RTX 2080 Ti", total_memory=11019MiB)

In [9]: nvidia1 = Device(uuid='GPU-01234567-89ab-cdef-0123-456789abcdef')  # from UUID string (or just`Device('GPU-xxxxxxxx-...')`)
   ...: nvidia2 = Device(bus_id='00000000:06:00.0')                        # from PCI bus ID
   ...: nvidia1
Out[9]: Device(index=1, name="GeForce RTX 2080 Ti", total_memory=11019MiB)

In [10]: cuda0 = CudaDevice(0)                        # from CUDA device index (equivalent to `CudaDevice(cuda_index=0)`)
    ...: cuda1 = CudaDevice(physical_index=8)         # from physical device index
    ...: cuda3 = CudaDevice(uuid='GPU-xxxxxxxx-...')  # from UUID string
    ...: cuda0
Out[10]:
CudaDevice(cuda_index=0, physical_index=9, name="NVIDIA GeForce RTX 2080 Ti", total_memory=11019MiB)

In [11]: nvidia0.memory_used()  # in bytes
Out[11]: 9293398016

In [12]: nvidia0.memory_used_human()
Out[12]: '8862MiB'

In [13]: nvidia0.gpu_utilization()  # in percentage
Out[13]: 5

In [14]: nvidia0.processes()
Out[14]: {
    52059: GpuProcess(pid=52059, gpu_memory=7885MiB, type=C, device=Device(index=0, name="GeForce RTX 2080 Ti", total_memory=11019MiB), host=HostProcess(pid=52059, name='ipython3', status='sleeping', started='14:31:22')),
    53002: GpuProcess(pid=53002, gpu_memory=967MiB, type=C, device=Device(index=0, name="GeForce RTX 2080 Ti", total_memory=11019MiB), host=HostProcess(pid=53002, name='python', status='running', started='14:31:59'))
}

In [15]: nvidia1_snapshot = nvidia1.as_snapshot()
    ...: nvidia1_snapshot
Out[15]: DeviceSnapshot(
    real=Device(index=1, name="GeForce RTX 2080 Ti", total_memory=11019MiB),
    bus_id='00000000:05:00.0',
    compute_mode='Default',
    clock_infos=ClockInfos(graphics=1815, sm=1815, memory=6800, video=1680),  # in MHz
    clock_speed_infos=ClockSpeedInfos(current=ClockInfos(graphics=1815, sm=1815, memory=6800, video=1680), max=ClockInfos(graphics=2100, sm=2100, memory=7000, video=1950)),  # in MHz
    current_driver_model='N/A',
    decoder_utilization=0,              # in percentage
    display_active='Disabled',
    display_mode='Disabled',
    encoder_utilization=0,              # in percentage
    fan_speed=22,                       # in percentage
    gpu_utilization=17,                 # in percentage (NOTE: this is the utilization rate of SMs, i.e. GPU percent)
    index=1,
    max_clock_infos=ClockInfos(graphics=2100, sm=2100, memory=7000, video=1950),  # in MHz
    memory_clock=6800,                  # in MHz
    memory_free=10462232576,            # in bytes
    memory_free_human='9977MiB',
    memory_info=MemoryInfo(total=11554717696, free=10462232576, used=1092485120)  # in bytes
    memory_percent=9.5,                 # in percentage (NOTE: this is the percentage of used GPU memory)
    memory_total=11554717696,           # in bytes
    memory_total_human='11019MiB',
    memory_usage='1041MiB / 11019MiB',
    memory_used=1092485120,             # in bytes
    memory_used_human='1041MiB',
    memory_utilization=7,               # in percentage (NOTE: this is the utilization rate of GPU memory bandwidth)
    mig_mode='N/A',
    name='GeForce RTX 2080 Ti',
    performance_state='P2',
    persistence_mode='Disabled',
    power_limit=250000,                 # in milliwatts (mW)
    power_status='66W / 250W',          # in watts (W)
    power_usage=66051,                  # in milliwatts (mW)
    sm_clock=1815,                      # in MHz
    temperature=39,                     # in Celsius
    total_volatile_uncorrected_ecc_errors='N/A',
    utilization_rates=UtilizationRates(gpu=17, memory=7, encoder=0, decoder=0),  # in percentage
    uuid='GPU-01234567-89ab-cdef-0123-456789abcdef'
)

In [16]: nvidia1_snapshot.memory_percent  # snapshot uses properties instead of function calls
Out[16]: 9.5

In [17]: nvidia1_snapshot['memory_info']  # snapshot also supports `__getitem__` by string
Out[17]: MemoryInfo(total=11554717696, free=10462232576, used=1092485120)

In [18]: nvidia1_snapshot.bar1_memory_info  # snapshot will automatically retrieve not presented attributes from `real`
Out[18]: MemoryInfo(total=268435456, free=257622016, used=10813440)
NOTE: Some entry values may be 'N/A' (type: NaType, subclass of str) when the corresponding resources are not applicable. You can use entry != 'N/A' conditions to avoid exceptions. It's safe to use float(entry) for numbers while NaType will be converted to math.nan. For example:
memory_used: Union[int, NaType] = device.memory_used()            # memory usage in bytes or `'N/A'`
memory_used_in_mib: float       = float(memory_used) / (1 << 20)  # memory usage in Mebibytes (MiB) or `math.nan`
It's safe to compare NaType with numbers, but NaType is always larger than any number:
devices_by_used_memory = sorted(Device.all(), key=Device.memory_used, reverse=True)  # it's safe to compare `'N/A'` with numbers
devices_by_free_memory = sorted(Device.all(), key=Device.memory_free, reverse=True) # please add `memory_free != 'N/A'` checks if sort in descending order hereIn [19]: processes = nvidia1.processes() # type: Dict[int, GpuProcess]
...: processes
Out[19]: {
23266: GpuProcess(pid=23266, gpu_memory=1031MiB, type=C, device=Device(index=1, name="GeForce RTX 2080 Ti", total_memory=11019MiB), host=HostProcess(pid=23266, name='python3', status='running', started='2021-05-10 21:02:40'))
}
In [20]: process = processes[23266]
...: process
Out[20]: GpuProcess(pid=23266, gpu_memory=1031MiB, type=C, device=Device(index=1, name="GeForce RTX 2080 Ti", total_memory=11019MiB), host=HostProcess(pid=23266, name='python3', status='running', started='2021-05-10 21:02:40'))
In [21]: process.status() # GpuProcess will automatically inherit attributes from GpuProcess.host
Out[21]: 'running'
In [22]: process.cmdline() # type: List[str]
Out[22]: ['python3', 'rllib_train.py']
In [23]: process.command() # type: str
Out[23]: 'python3 rllib_train.py'
In [24]: process.cwd() # GpuProcess will automatically inherit attributes from GpuProcess.host
Out[24]: '/home/xxxxxx/Projects/xxxxxx'
In [25]: process.gpu_memory_human()
Out[25]: '1031MiB'
In [26]: process.as_snapshot()
Out[26]: GpuProcessSnapshot(
real=GpuProcess(pid=23266, gpu_memory=1031MiB, type=C, device=Device(index=1, name="GeForce RTX 2080 Ti", total_memory=11019MiB), host=HostProcess(pid=23266, name='python3', status='running', started='2021-05-10 21:02:40')),
cmdline=['python3', 'rllib_train.py'],
command='python3 rllib_train.py',
cpu_percent=98.5, # in percentage
device=Device(index=1, name="GeForce RTX 2080 Ti", total_memory=11019MiB),
gpu_encoder_utilization=0, # in percentage
gpu_decoder_utilization=0, # in percentage
gpu_memory=1081081856, # in bytes
gpu_memory_human='1031MiB',
gpu_memory_percent=9.4, # in percentage (NOTE: this is the percentage of used GPU memory)
gpu_memory_utilization=5, # in percentage (NOTE: this is the utilization rate of GPU memory bandwidth)
gpu_sm_utilization=0, # in percentage (NOTE: this is the utilization rate of SMs, i.e. GPU percent)
identity=(23266, 1620651760.15, 1),
is_running=True,
memory_percent=1.6849018430285683, # in percentage (NOTE: this is the percentage of used host memory)
name='python3',
pid=23266,
running_time=datetime.timedelta(days=1, seconds=80013, microseconds=470024),
running_time_human='46:13:33',
type='C', # 'C' for Compute / 'G' for Graphics / 'C+G' for Both
username='panxuehai'
)
In [27]: process.uids() # GpuProcess will automatically inherit attributes from GpuProcess.host
Out[27]: puids(real=1001, effective=1001, saved=1001)
In [28]: process.kill() # GpuProcess will automatically inherit attributes from GpuProcess.host
In [29]: list(map(Device.processes, all_devices)) # all processes
Out[29]: [
{
52059: GpuProcess(pid=52059, gpu_memory=7885MiB, type=C, device=Device(index=0, name="GeForce RTX 2080 Ti", total_memory=11019MiB), host=HostProcess(pid=52059, name='ipython3', status='sleeping', started='14:31:22')),
53002: GpuProcess(pid=53002, gpu_memory=967MiB, type=C, device=Device(index=0, name="GeForce RTX 2080 Ti", total_memory=11019MiB), host=HostProcess(pid=53002, name='python', status='running', started='14:31:59'))
},
{},
{},
{},
{},
{},
{},
{},
{
84748: GpuProcess(pid=84748, gpu_memory=8975MiB, type=C, device=Device(index=8, name="GeForce RTX 2080 Ti", total_memory=11019MiB), host=HostProcess(pid=84748, name='python', status='running', started='11:13:38'))
},
{
84748: GpuProcess(pid=84748, gpu_memory=8341MiB, type=C, device=Device(index=9, name="GeForce RTX 2080 Ti", total_memory=11019MiB), host=HostProcess(pid=84748, name='python', status='running', started='11:13:38'))
}
]
In [30]: this = HostProcess(os.getpid())
...: this
Out[30]: HostProcess(pid=35783, name='python', status='running', started='19:19:00')
In [31]: this.cmdline() # type: List[str]
Out[31]: ['python', '-c', 'import IPython; IPython.terminal.ipapp.launch_new_instance()']
In [32]: this.command() # not simply `' '.join(cmdline)` but quotes are added
Out[32]: 'python -c "import IPython; IPython.terminal.ipapp.launch_new_instance()"'
In [33]: this.memory_info()
Out[33]: pmem(rss=83988480, vms=343543808, shared=12079104, text=8192, lib=0, data=297435136, dirty=0)
In [34]: import cupy as cp
...: x = cp.zeros((10000, 1000))
...: this = GpuProcess(os.getpid(), cuda0) # construct from `GpuProcess(pid, device)` explicitly rather than calling `device.processes()`
...: this
Out[34]: GpuProcess(pid=35783, gpu_memory=N/A, type=N/A, device=CudaDevice(cuda_index=0, physical_index=9, name="NVIDIA GeForce RTX 2080 Ti", total_memory=11019MiB), host=HostProcess(pid=35783, name='python', status='running', started='19:19:00'))
In [35]: this.update_gpu_status() # update used GPU memory from new driver queries
Out[35]: 267386880
In [36]: this
Out[36]: GpuProcess(pid=35783, gpu_memory=255MiB, type=C, device=CudaDevice(cuda_index=0, physical_index=9, name="NVIDIA GeForce RTX 2080 Ti", total_memory=11019MiB), host=HostProcess(pid=35783, name='python', status='running', started='19:19:00'))
In [37]: id(this) == id(GpuProcess(os.getpid(), cuda0)) # IMPORTANT: the instance will be reused while the process is running
Out[37]: TrueHost (inherited from psutil)
In [38]: host.cpu_count()
Out[38]: 88

In [39]: host.cpu_percent()
Out[39]: 18.5

In [40]: host.cpu_times()
Out[40]: scputimes(user=2346377.62, nice=53321.44, system=579177.52, idle=10323719.85, iowait=28750.22, irq=0.0, softirq=11566.87, steal=0.0, guest=0.0, guest_nice=0.0)

In [41]: host.load_average()
Out[41]: (14.88, 17.8, 19.91)

In [42]: host.virtual_memory()
Out[42]: svmem(total=270352478208, available=192275968000, percent=28.9, used=53350518784, free=88924037120, active=125081112576, inactive=44803993600, buffers=37006450688, cached=91071471616, shared=23820632064, slab=8200687616)

In [43]: host.memory_percent()
Out[43]: 28.9

In [44]: host.swap_memory()
Out[44]: sswap(total=65534947328, used=475136, free=65534472192, percent=0.0, sin=2404139008, sout=4259434496)

In [45]: host.swap_percent()
Out[45]: 0.0
Example output of nvitop -1:

Example output of nvitop:
| Full | Compact |
 |
 |
Tree-view screen (shortcut: t) for GPU processes and their parents:

NOTE: The process tree is built in backward (recursively back to the tree root). Only GPU processes along with their children and parents (and grandparents ...) will be shown. Not all running processes will be displayed.
Environment variable screen (shortcut: e):

nvitop is released under the GNU General Public License, version 3 (GPLv3).
NOTE: Please feel free to use nvitop as a package or dependency for your own projects. However, if you want to add or modify some features of nvitop, or copy some source code of nvitop into your own code, the source code should also be released under the GPLv3 License (as nvitop contains some modified source code from ranger under the GPLv3 License).
- colorize device information based on the load intensity
- basic process information both on the device and host
- GPU process management (interrupt / terminate / kill)
- bar plots and history graphs
- process sorting
- help screen
- callbacks for TensorFlow (Keras) and PyTorch Lightning
- process environment variable screen
- process filtering
- process management for parent processes (tree view / interrupt / terminate / kill)
- scrollable process list for large amounts of processes
- NVIDIA MIG GPU support (help wanted for testing)
- web interface (under consideration)
- AMD ROCm support (help wanted for testing)