此数据为某电商平台2018年2月份到2018年4月15号的消费者数据,本文会对电商的用户基础数据、用户行为数据、产品数据、商家数据做一个探索性分析,最后对平台的整体的运营指标数据做一个整体分析
import pandas as pd
import matplotlib.pyplot as plt
import seaborn as sns
import xlwt
%matplotlib inlinejd_consumer=pd.read_excel('../data/京东消费者分析数据.xlsx',sheet_name='JD_Fnl')jd_consumer.head()jd_consumer.info();<class 'pandas.core.frame.DataFrame'>
RangeIndex: 183828 entries, 0 to 183827
Data columns (total 24 columns):
customer_id 183828 non-null int64
product_id 183828 non-null int64
action_time 183828 non-null datetime64[ns]
action_id 183828 non-null int64
type 183828 non-null object
age_range 183745 non-null float64
gender 183828 non-null object
customer_register_date 183828 non-null datetime64[ns]
customer_level 183828 non-null int64
city_level 183703 non-null float64
brand 183828 non-null object
shop_id 183828 non-null int64
category 183828 non-null object
product_market_date 183828 non-null datetime64[ns]
vender_id 183828 non-null int64
fans_number 183828 non-null int64
vip_number 183828 non-null int64
shop_register_date 112474 non-null datetime64[ns]
shop_category 183828 non-null object
shop_score 183828 non-null float64
action_hour 183828 non-null object
action_month 183828 non-null object
action_day 183828 non-null object
action_date 183828 non-null object
dtypes: datetime64[ns](4), float64(3), int64(8), object(9)
memory usage: 33.7+ MB
jd_consumer['action_date'].describe()该数据包含2018年2月1号到2018年4月15号的数据
count                  183828
unique                  75858
top       2018-02-04 22:53:00
freq                       15
first     2018-02-01 00:00:00
last      2018-04-15 23:59:00
Name: action_date, dtype: object
为了方便理解数据,方便做数据分析,先给数据做一些分类
| 用户基础数据 | 用户行为数据 | 产品数据 | 商家数据 |
|---|---|---|---|
| age_range 年龄分段 gender 性别 customer_registerdate 客户注册日期 customer_level 会员等级 city_level 会员城市等级 |
action_date 行为时间 action_id 行为编码 type 行为类别 |
product_id 产品编码 brand 产品品牌 product_market_date 产品上市时间 category 产品类别 |
shop_id 店铺编码 vender_id 商家编码 fans_number 粉丝数 vip_number 会员数 shop_register_dage开店时间 shop_category 店铺主营 shop_score店铺打分 |
先对用户基础、用户行为数据、产品数据、商家做一个探索性数据分析,便于我们对数据有一个整体的认知,增加对数据的感知度。
#对用户数据去重
jd_consumer_base=jd_consumer[['gender','customer_id','age_range','customer_register_date',
'customer_level','city_level']].drop_duplicates()jd_consumer.rename(columns={'action_date':'action_time'},inplace=True)- 性别、年龄段,会员等级分布
#性别
gender_df=jd_consumer_base.gender.value_counts().reset_index(name='count')
gender_col=gender_df['index']

#年龄段
age_df=jd_consumer_base.age_range.value_counts().reset_index(name='count')
age_col=age_df['index']

#会员等级
customer_level_df=jd_consumer_base.customer_level.value_counts().reset_index(name='count')
customer_level_col=customer_level_df['index']fig,axes=plt.subplots(1,3,figsize=(15,5))
axes[0].pie(gender_df['count'],labels=gender_col,autopct = '%3.1f%%',colors=plt.cm.Dark2.colors)
axes[0].set_title('gender')
axes[1].pie(age_df['count'],labels=age_col,autopct = '%3.1f%%',colors=plt.cm.Dark2.colors)
axes[1].set_title('age_range')
axes[2].pie(customer_level_df['count'],labels=customer_level_col,autopct = '%3.1f%%',colors=plt.cm.Dark2.colors)
axes[2].set_title('customer_level');平台上活跃用户男性占61%,女性占38%
年龄有6个分段,年龄分段在5和6的占大多数,总共占总体的76%
会员等级分为1~7级,7级的人数最多,1、5级也占有较多比重,仅次于7级的人数
- 城市
order=jd_consumer_base['city_level'].value_counts().index
sns.countplot(data=jd_consumer_base,x='city_level',order=order);
活跃人数主要集中在4、3、5、1等级的城市
jd_shop=jd_consumer[['shop_id','vender_id','fans_number','vip_number',
                          'shop_register_date','shop_category','shop_score']].drop_duplicates()
#剔除异常值,只保留店铺评分大于0的数据
jd_shop=jd_shop[jd_shop['shop_score']>0]- 前十大主营业务
import squarify

df = jd_shop.groupby('shop_category').size().reset_index(name='counts').sort_values(by='counts',ascending=False)
labels = df.apply(lambda x: str(x[0]) + "\n (" + str(x[1]) + ")", axis=1)
sizes = df['counts'].values.tolist()
colors = [plt.cm.Spectral(i/float(len(labels))) for i in range(len(labels))]

# Draw Plot
plt.figure(figsize=(10,7), dpi= 80)
squarify.plot(sizes=sizes, label=labels, color=colors, alpha=.8)

# Decorate
plt.title('Treemap of shop_category')
plt.axis('off')
plt.show()
店铺主营种类共有9种,其中大多的店都主营食品、家用电器、家私、服饰、美妆
jd_shop['shop_category'].value_counts()Food 1106
Household Eletric Appliance 1015
Furniture 898
Clothes 767
Beauty Makeup 740
Jewellery Accessories 301
Mother and Infant 231
Outdoor Sports 126
Electronics 27
Name: shop_category, dtype: int64
shop_order=jd_shop.groupby('shop_category')['fans_number'].mean().sort_values().index.tolist()
sns.barplot(x='shop_category',y='fans_number',data=jd_shop,order=shop_order)
plt.xticks(rotation=-80);
图中柱状图上的黑条,统计学上叫做置信区间,代表着95%的店铺所对应的粉丝数在黑条的区间范围内。
我们可以发现,主营母婴、家私、家用电子产品、服饰店铺的平均粉丝数都超过了3.5k,其中开母婴店的平均粉丝数最多。买这些东西,或许用户更偏向于自己信赖或者喜欢的店家
jd_shop.groupby('shop_category')['fans_number'].mean().sort_values()shop_category
Jewellery Accessories 10198.803987
Electronics 13586.703704
Food 15579.532550
Outdoor Sports 18121.952381
Beauty Makeup 26484.836486
Clothes 35846.930900
Household Eletric Appliance 36358.644335
Furniture 41710.139198
Mother and Infant 43201.896104
Name: fans_number, dtype: float64
jd_product=jd_consumer[jd_consumer['type'].isin(['PageView','Order'])]
jd_product_pv=jd_consumer[jd_consumer['type']=='PageView']
jd_product_order=jd_consumer[jd_consumer['type']=='Order']- 前十大被浏览最多的产品品牌、产品品类以及销量
fig,axes=plt.subplots(1,3,figsize=(15,5))
jd_product_pv['brand'].value_counts()[:10].plot.barh(title='top10 brand of pv',ax=axes[0])
jd_product_pv['category'].value_counts()[:10].plot.barh(ax=axes[1],title='top10 category of pv')
jd_product_order['category'].value_counts()[:10].plot.barh(ax=axes[2],title='top10 category of order')
plt.tight_layout();
浏览占比最多的是不知名的品牌,其次是华为与苹果
浏览最多的产品是是手机和外套
被购买最多的是外套和茶,这个季节还是冬季,买外套和茶也合乎常理
#对列重命名
jd_consumer.rename(columns={'action_date':'action_time'},inplace=True)
#提取时间中的小时时段
jd_consumer['action_hour']=jd_consumer['action_time'].apply(lambda x:pd.datetime.strftime(x,'%H'))
jd_consumer_behavior=jd_consumer[['action_hour','customer_id','type']].drop_duplicates()behavior_gb=jd_consumer_behavior.groupby('action_hour').size().reset_index(name='count')
sns.lineplot(x='action_hour',y='count',data=behavior_gb);从下午6点开始,用户使用app的人数逐渐增多,一直到晚上10点达到顶峰。这也符合预期,人们在晚上有较多的空闲时间来支配。
上面完成对基础数据的了解,现在需要对关键的运营指标做分析了,比如日活、月活,下单转化率等。
这些指标需要对比分析才能知道好坏,此份数据包含了18年2月份到18年4月15号的数据,我只拿出2月份与3月份的数据来做对比分析,看看其中的差异
- 用户月活跃量分析
#对时间数据做一些处理
jd_consumer['action_month']=jd_consumer['action_time'].apply(lambda x:pd.datetime.strftime(x,'%Y-%m'))
jd_consumer['action_day']=jd_consumer['action_time'].apply(lambda x:pd.datetime.strftime(x,'%d'))
jd_consumer['action_date']=jd_consumer['action_time'].apply(lambda x:pd.datetime.strftime(x,'%Y-%m-%d'))
#取2、3月份的数据
jd_consumer_2m3m=jd_consumer[jd_consumer['action_month']!='2018-04']month_active=jd_consumer_2m3m[['customer_id','action_month']].drop_duplicates()
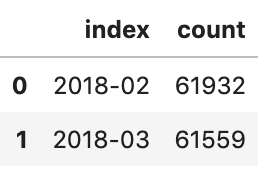
month_active['action_month'].value_counts().reset_index(name='count')从整体数据上看2018-3比2018/2的活跃用户环比下降了 0.6%,没有太大的波动
- 日活对比分析
day_active=jd_consumer_2m3m[['customer_id','action_day','action_month','type']].drop_duplicates()
jd_consumer_2m=day_active[day_active['action_month']=='2018-02']
jd_consumer_3m=day_active[day_active['action_month']=='2018-03']
jd_consumer_2d=jd_consumer_2m['action_day'].value_counts().reset_index(
    name='count').sort_values(by='index',ascending=True)
jd_consumer_3d=jd_consumer_3m['action_day'].value_counts().reset_index(
    name='count').sort_values(by='index',ascending=True)

fig,ax=plt.subplots(1,1,figsize=(10,5))
sns.lineplot(x='index',y='count',data=jd_consumer_2d)
sns.lineplot(x='index',y='count',data=jd_consumer_3d)
sns.countplot(data=day_active[day_active['type']=='Order'],x='action_day',hue='action_month');
#ax.legend(labels=['2018-02','2018-03']);
上面的折线图是2、3月份的日活趋势对比图,下面的直方图表示2、3月份的日销量对比图,
2月份,活跃人数从6号开始一直下滑,直到除夕之夜之后有所反弹,回升至22号,趋于平稳,上下微幅波动。 结合直方图,可以看到2月份1号到7号是一个购物的小高峰期,也就是春节前10天左右,符合节假日前的消费行为情况, 可以推断销量的下降是受春节假期的影响。用户会提前抢购年货,避免节日快递高峰期等。
3月份,27号的日活出现断崖式下跌,直接影响了28号的日活,但奇怪的是27、28号的销量却没有出现太大的波动,和往日差不多。 对于这个奇怪的现象我们需要进一步的探索
- 18年3月份,27号日活骤降的原因分析
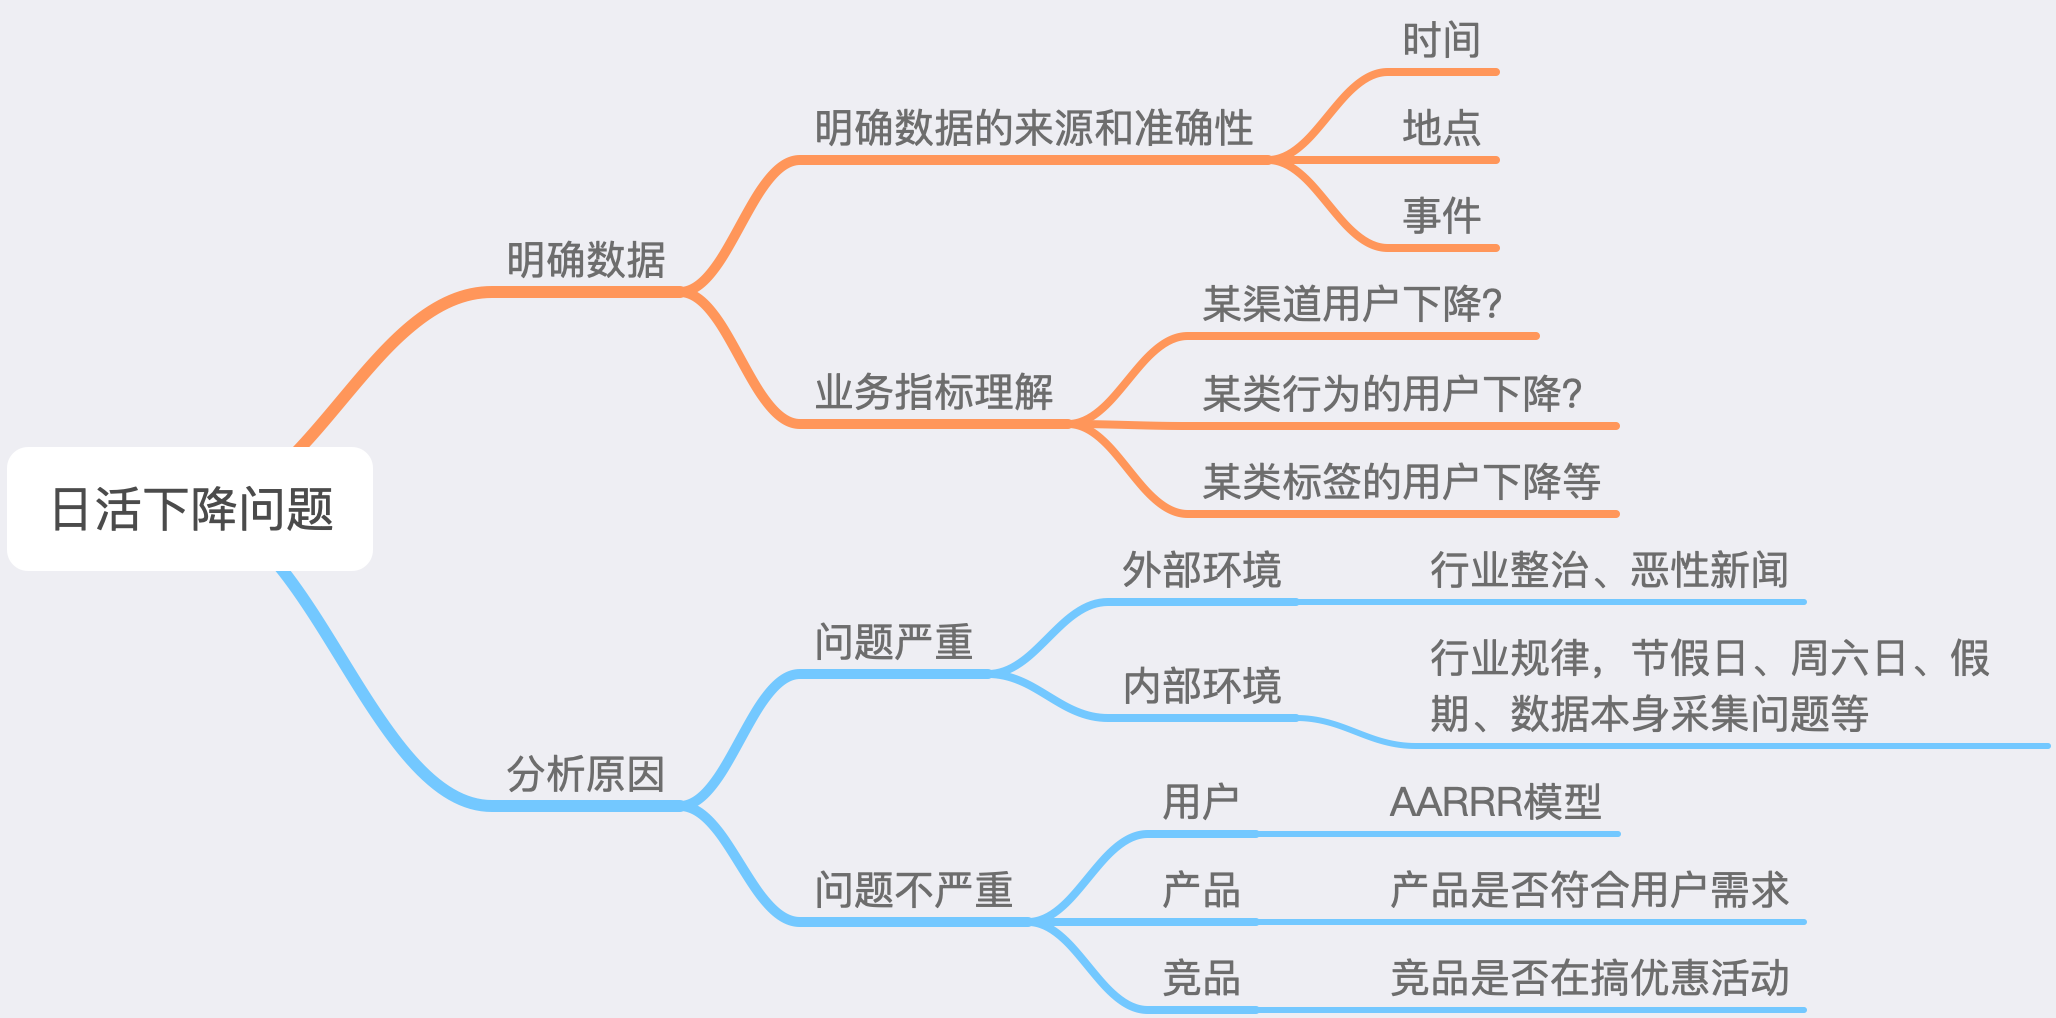
关于日活下降的原因,可以从这几个步骤去寻找缘由
#用户的那些应为是下降的
type_3m=jd_consumer_3m.groupby(['action_day','type']).size().reset_index(name='count')
sns.lineplot(x='action_day',y='count',hue='type',data=a);
可以看出,除了用户的页面浏览人数骤降外,其它的行为是正常的, 大致可以判断,那天应该是这部分的数据采集除了问题,导致数据没有完全统计到, 当然这也需要跟数据采集的同事去确认才能100%确定。
- 下单转化率分析
这类转化率的问题,常用的到模型AARRR漏斗分析模型。由于数据中的用户行为类别不是很多,我就职选取了浏览到下单这两个数据做转化率分析
2018年2月份浏览-下单转化量
2018年3月份浏览-下单转化量
2月份的下单转化率为5.4%,3月份的下单的转化率为7.6%,3月份的下单的转化率比2月份提升了2%,是一个很大的提升。
虽然转化率有所提升,但原始数据缺少了购买金额,无法分析客单价,销售额等数据,所以也就无法判断销售情况
jd_consumer_order=jd_consumer_2m3m[jd_consumer_2m3m['type']=='Order']
#jd_consumer_order_2m=jd_consumer_order[jd_consumer_order['action_month']=='2018-02']
#order_2m=jd_consumer_order_2m['category'].value_counts().reset_index(name='2018-02')[:20]
jd_consumer_order_3m=jd_consumer_order[jd_consumer_order['action_month']=='2018-03']
order_3m=jd_consumer_order_3m['category'].value_counts().reset_index(name='2018-03')

fig,axes = plt.subplots(1,1,figsize=(20,7))
sns.countplot(data=jd_consumer_order,x='category',hue='action_month',order=order_3m['index'])
plt.xticks(rotation=-80);
图中可看出,2月份,除了外套、手机、牛仔裤、记事本的销量比3月份的多,其余的物品则是3月份的销量都高于2月份。 虽然3月份很多物品的销量都要高于2月份,但也不能肯定3月份的销售额就比2月份好, 如果外套、手机、牛仔裤的客单价很高的话,就能抬高2月份整体的销售额。
通过探索数据分析,可以深入的感知用户基础数据、用户行为数据、产品数据、商家数据,这对后面的对比分析起到了一个非常大的帮助作用。 从这两个月的数据对比来看,运营的情况整体是朝着一个良性的方向缓缓发展的。
这样的分析只是在业务上做了一个解释,或者只是解释了一个已经发生的事情为什么会这样,但这样还远远不够,怎么样通过分析数据,然后反馈到业务去实现业务的增长呢?这是一个需要去考虑的核心问题。而下面的用户的画像就是回答这个问题的答案。
用户画像即用户信息标签化,通过收集用户社会属性、消费习惯、偏好特征等各个维度数据,进而对用户或者产品特征属性的刻画,并对这些特征分析统计挖掘潜在价值信息,从而抽象出一个用户的信息全貌,可看做是企业应用大数据的根基,是定向广告投放与个性化推荐的前置条件
- 标签总览表
| 标签名称 | 标签英文名称 | 标签取值 | 标签类型(1-分类2-统计) | 开发方式(1-算法2-统计) | 是否互斥(0-不1-是) |
|---|---|---|---|---|---|
| 用户浏览最活跃的时段 | pageview_hour_bin_max | 凌晨/上午/中午/下午/晚上 | 1 | 2 | 0 |
| 用户加购最活跃的时段 | savedcart_hour_bin_max | 凌晨/上午/中午/下午/晚上 | 1 | 2 | 0 |
| 用户下单最活跃的时段 | order_hour_bin_max | 凌晨/上午/中午/下午/晚上 | 1 | 2 | 0 |
| 用户浏览最多的商品 | pageview_category_max | 商品名称 | 2 | 2 | 0 |
| 用户加购最多的商品 | savedcart_category_max | 商品名称 | 2 | 2 | 0 |
| 用户下单最多的商品 | order_category_max | 商品名称 | 2 | 2 | 0 |
| 用户近7天下单次数 | count_7_order | 正整数 | 2 | 2 | 0 |
| 用户近7天加购次数 | count_7_savedcart | 正整数 | 2 | 2 | 0 |
| 用户近15天下单次数 | count_15_order | 正整数 | 2 | 2 | 0 |
| 用户近15天加购次数 | count_15_savedcart | 正整数 | 2 | 2 | 0 |
| 用户近7天活跃天数 | count_7_active | 正整数 | 2 | 2 | 0 |
| 用户近15天活跃天数 | count_15_active | 正整数 | 2 | 2 | 0 |
| 用户最后一次浏览距给定时间的天数 | pageview_days | 正整数 | 2 | 2 | 0 |
| 用户最后一次下单距给定时间的天数 | order_days | 正整数 | 2 | 2 | 0 |
| 用户是否浏览未下单 | pageview_not_order | 是/否 | 1 | 2 | 1 |
| 用户是否加购未下单 | savedcart_not_order | 是/否 | 1 | 2 | 1 |
| 用户是否是否复购 | order_again | 是/否 | 1 | 2 | 1 |
| 用户购买商品是否单一 | order_single | 是/否 | 1 | 2 | 1 |
- 用户画像(统计)
#代码目录 ./code/user_labels.py
user_labels=pd.read_excel('../data/京东消费者用户画像标签2018-04.xlsx')
user_labels.head()- 用户十大偏好标签
#代码目录 ./code/user_personalized_tag.py
user_tag_special=pd.read_excel('../data/京东消费者个性化标签偏好.xlsx')
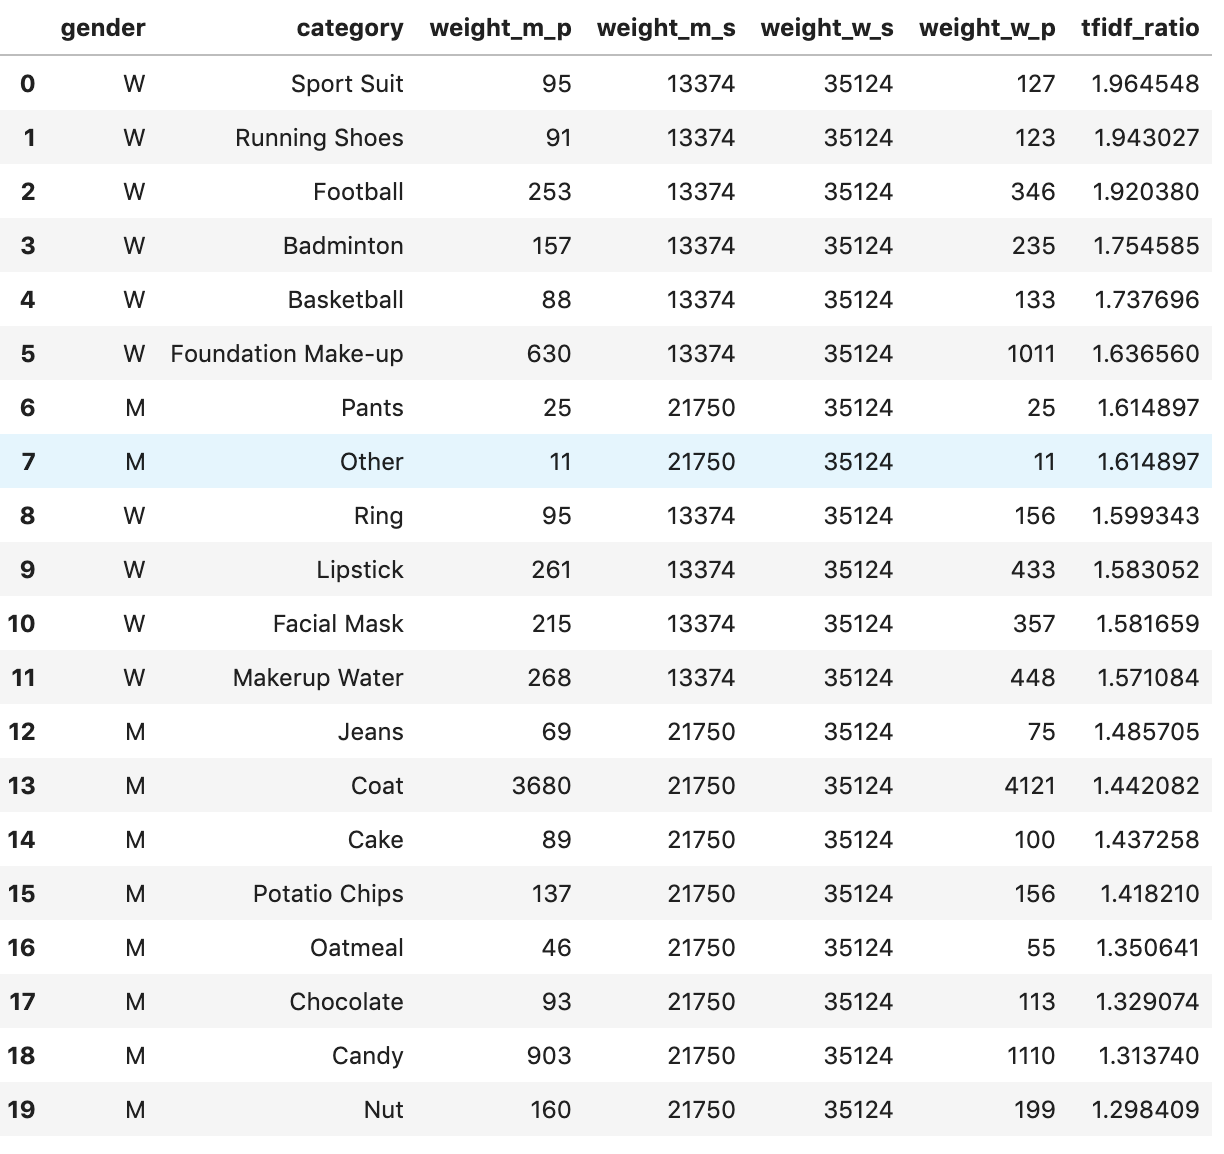
user_tag_special.head()- 群体十大偏好标签
#代码目录 ./code/user_personalized_tag.py
group_tag_special=pd.read_excel('../data/京东消费者群体标签偏好.xlsx')
group_tag_special企业可根据用户行为画像、用户商品偏好画像可以满足企业精细化运营,促进新增长;也可以定下投放广告,获取目标用户;也可制作推荐策略,促进目标用户消费等等
在一个数据分析体系中,提出问题和发现问题是非常重要的,一个好的问题就相当问题解决了一半。解决细节问题,需要探索性分析,一步一步的发现关键点,而为了解决趋势性的问题,就需要有用户画像,这将为一个大的方向提供有价值的信息。


