This "Stacked Triangle" data visualization gives a recap of a match and shows the order in which teams scored. This works for several sport disciplines when teams or individuals win by scoring goals or points.

To use this visualization, simply open the triangle_stacks.html file in a web browser. No web server is required.
The visualization is using D3.js.
The data array contains the progress of the match in terms of goals scored. You can edit the 3-letter country codes to show different teams.
const TEAM1 = "BRA";
const TEAM2 = "CRO";

const data = [
  [0,1],
  [0,2],
  [1,2],
  [2,2],
  [2,3],
  [3,3],
  [3,4],
  [3,5],
  [4,5],
  [5,5],
  [6,5],
]

const colorSet = {
  "bg": "#f2eee3",
  "team1": "#eb7150",
  "team2": "#222"
}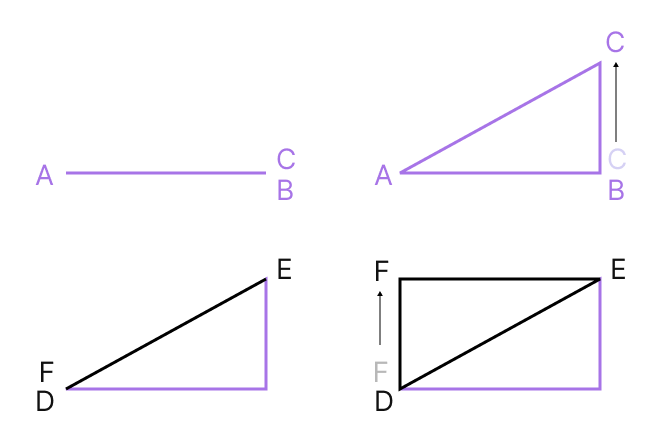
The animation is built by adding simple triangles on top of one another. The starting shape appears as a simple line, but it is actually a polygon with three points, where point B and C are in the exact same position. With a transition, we move point C upwards to make the triangle appear. When the other team scores a goal, we add a new line created by three points on the edge of the previous triangle, covering the line between points A and C. Then, we move point F up in the same way as we did with point C.
const triangles = {
  team1: {
    startPoly: [C1X, c1y, C2X, c2y, C1X, c1y],
    finalPoly: [C1X, c1y, C2X, c2y, C1X, COLUMNH - scaleY(d[0])],
    score: d[0],
  },
  team2: {
    startPoly: [C1X, c1y, C2X, c2y, C2X, c2y],
    finalPoly: [C1X, c1y, C2X, c2y, C2X, COLUMNH - scaleY(d[1])],
    score: d[1],
  }
};

changePolygon = function (whichTeamScored) {
  vizGroup.append("polygon")
    .attr("points", triangles[whichTeamScored].startPoly.join(","))
    .transition()
    .duration(TRIANIMDURATION)
    .attr("points", triangles[whichTeamScored].finalPoly.join(","))
}- An editable variation with gif export is available at PlotParade
- Animated Sport Results
- FIFA World Cup 2022
Please note that the following features are not included in this code:
- GIF Export
- Penalty score visualization
- Gaps for halves, periods, quarters, overtime, etc.
- Visualizing points when two opponents score a point simultaneously (e.g., fencing).