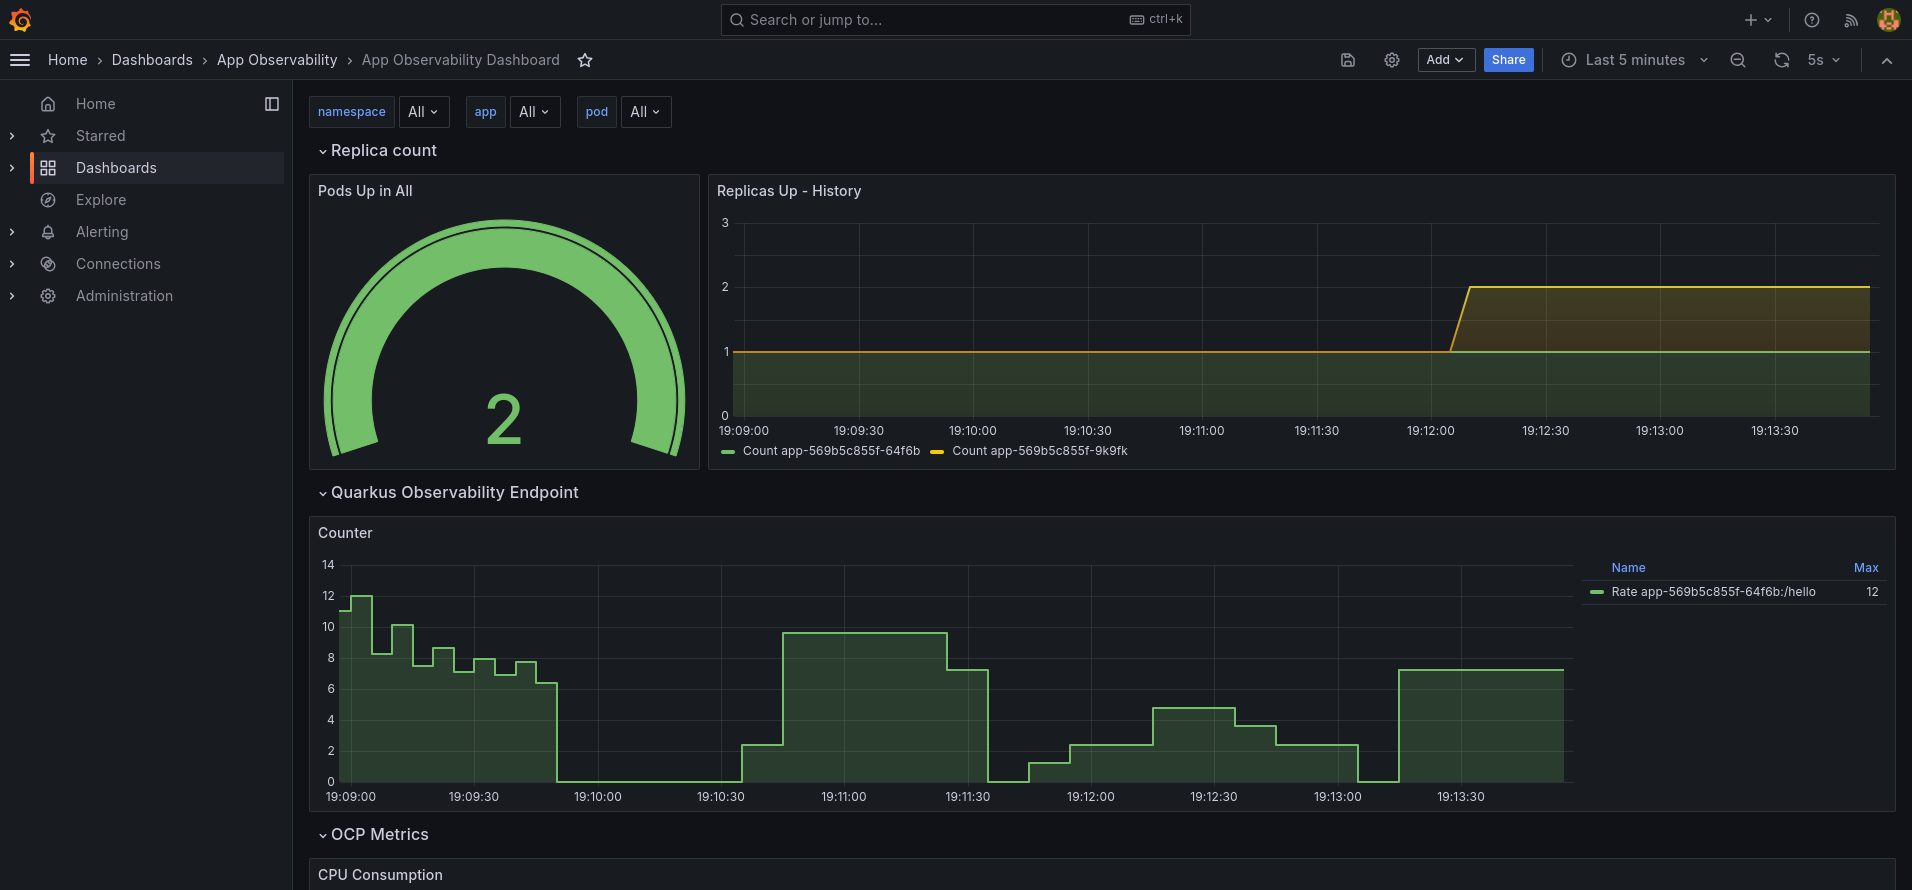
This application showcases how to configure Logging, Metrics, and Tracing in a Quarkus and collect and manage them using the supported infrastructure of Openshift.
|
ℹ️
|
In this section I have new great features! |
The application is built using Quarkus, a container-first framework for writing Java applications.
| Extension Name | Purpose |
|---|---|
Expose Metrics |
|
Format Logs in JSON |
|
Distributed Tracing |
|
Live and Running endpoints |
In order to collect the logs, metrics, and traces from our application, we are going to deploy and configure several Openshift components.
| Openshift Component | Purpose |
|---|---|
Collect metrics from containers like memory, cpu, networking, etc. to display on Grafana and match with user-workload-monitoring |
|
Collect metrics in OpenMetrics format from user workloads and present it in the built-in dashboard. |
|
The Alertmanager service handles alerts received from Prometheus. Alertmanager is also responsible for sending the alerts to external notification systems. |
|
Collect and display distributed traces. It is based on the Grafana Tempo project. It uses the OpenTelemetry standard. |
|
Collect, store, and visualize application, infrastructure and audit logs. |
Apart from Red Hat supported components like the ones listed in the previous section, we are also going to use community projects. As of today, we only use the Grafana operator to deploy a Grafana cluster.
| Component | Purpose |
|---|---|
The Grafana Operator is a Kubernetes operator built to help you manage your Grafana instances and its resources in and outside of Kubernetes. |
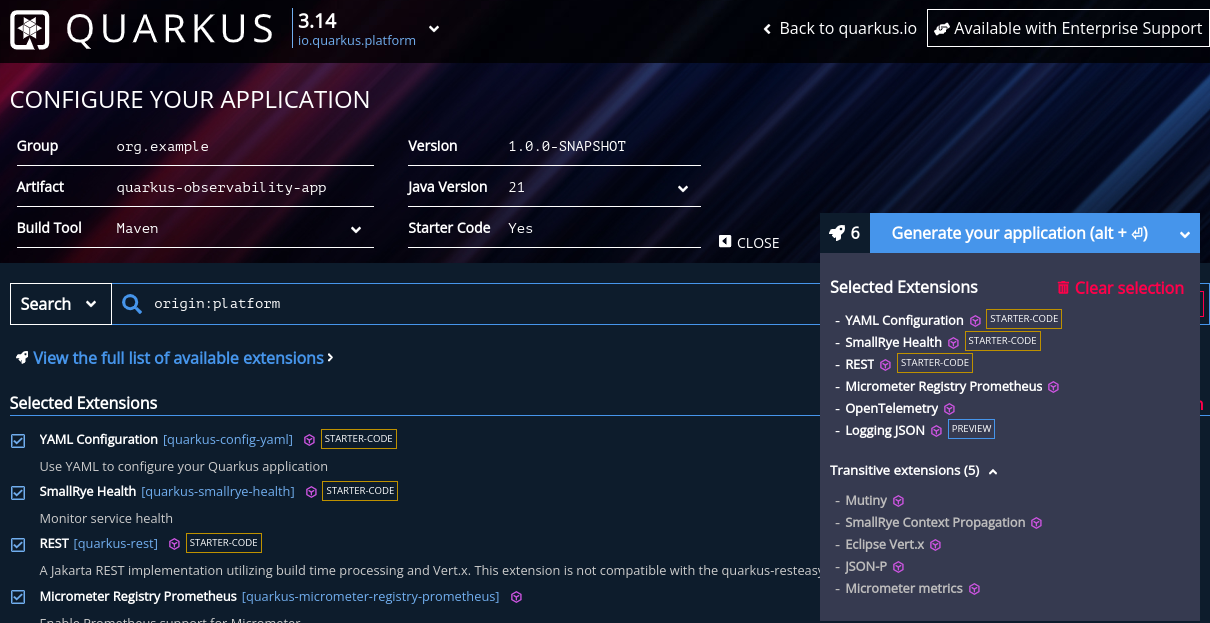
Access the Code Quarkus site that will help you to generate the application quickstart with the Quarkus extensions:
Generate the application and download it as .zip.
The application is similar to the autogenerated version, but with the following customizations:
-
I’ve added a new endpoint to count something using the Swagger OpenApi library.
-
I’ve used the Micrometer metrics library to generate custom metrics that I will expose in the Prometheus endpoint. I’ve created three new metrics:
-
Gauges measure a value that can increase or decrease over time, like the speedometer on a car.
-
Counters are used to measure values that only increase.
-
Distribution summaries record an observed value, which will be aggregated with other recorded values and stored as a sum
-
You can run your application in dev mode that enables live coding using:
mvn compile quarkus:devNOTE: Quarkus now ships with a Dev UI, which is available in dev mode only at http://localhost:8080/q/dev/.
The application can be packaged using:
mvn packageIt produces the quarkus-run.jar file in the target/quarkus-app/ directory. Be aware that it’s not an uber-jar as the dependencies are copied into the target/quarkus-app/lib/ directory.
The application is now runnable using java -jar target/quarkus-app/quarkus-run.jar.
If you want to build an uber-jar, execute the following command:
mvn package -Dquarkus.package.type=uber-jarThe application, packaged as an uber-jar, is now runnable using java -jar target/*-runner.jar.
Manual steps to generate the container image locally:
# Generate the Native executable
mvn package -Pnative -Dquarkus.native.container-runtime=podman -Dquarkus.native.remote-container-build=true -Dquarkus.container-image.build=true

# Add the executable to a container image
podman build -f src/main/docker/Dockerfile.native -t quarkus/quarkus-observability-app .

# Launch the application
podman run -i --rm -p 8080:8080 quarkus/quarkus-observability-app|
ℹ️
|
This repository has been fully migrated to the GitOps pattern. This means that it is strongly recommended to deploy ArgoCD in order to deploy these components in an standard way. |
What do you need before installing the application?
-
This repo is tested on OpenShift version
4.16.16, but most of the configuration should work in previous versions. There has been changes to the code to adapt to latest releases, so you can always check old commits for old configurations :) -
Both Grafana Loki and Grafana Tempo relies on Object storage that is not available on OCP after installation. As I don’t want to mix things installing ODF (Super nice component), the
auto-install.shscript will use your AWS credentials to create two AWS S3 buckets on Amazon. -
This is the GitOps era, so you will need ArgoCD deployed on your cluster. I recommend using OpenShift GitOps and for that I have a really cool repo. Have a look at it here.
As this is a public repo, it is not possible to upload all the credentials freely to the git repository. For that reason, there is a script that will create some prerequisites (Buckets and Secrets mainly) before creating the app-of-apps pattern. Please execute the following script:
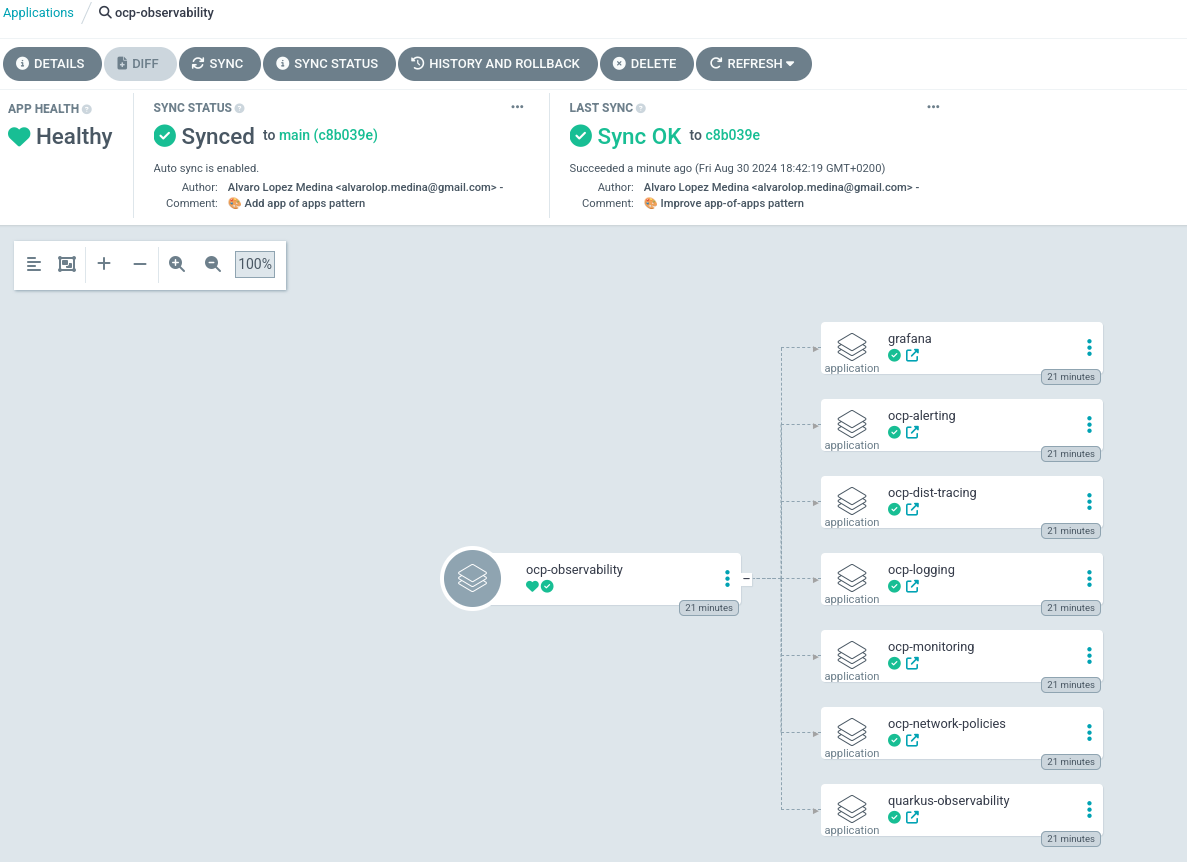
./auto-install.shAfter that, you should see the following apps on ArgoCD:
Deploy the app in a new namespace using the following command:
oc apply -f apps/application-quarkus-observability.yamlRed Hat build of OpenTelemetry product provides support for deploying and managing the OpenTelemetry Collector and simplifying the workload instrumentation. It can receive, process, and forward telemetry data in multiple formats, making it the ideal component for telemetry processing and interoperability between telemetry systems.
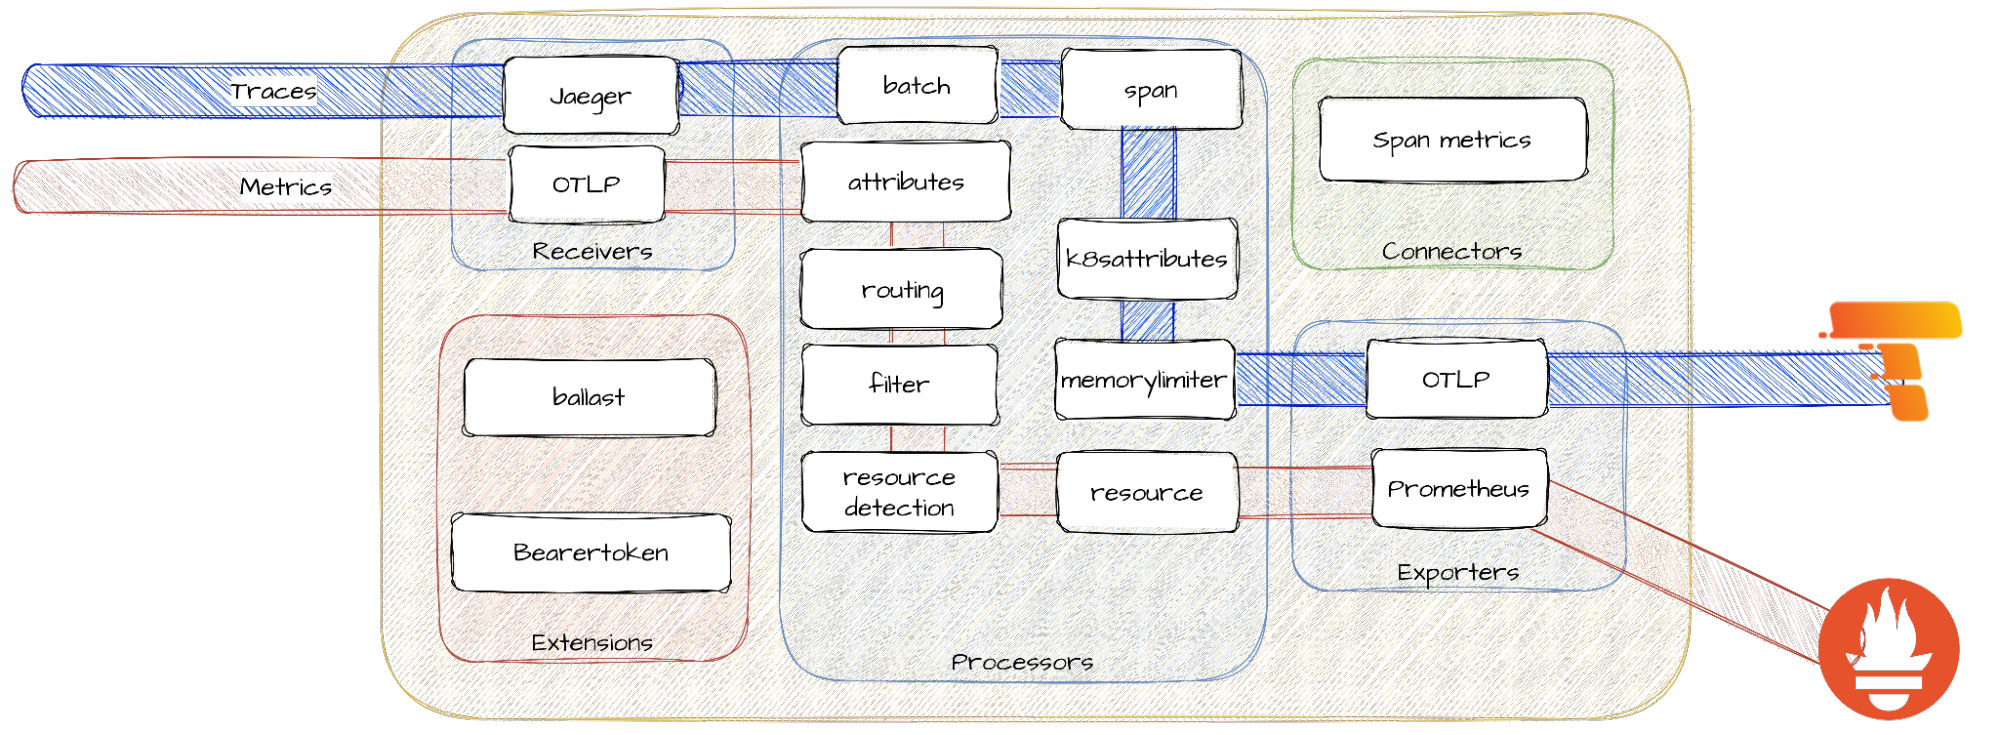
OpenTelemetry is made of several components that interconnect to process metrics and traces. The following diagram from this blog will help you to understand the architecture:
For more context about OpenTelemetry, I strongly recommend reading the following blogs:
|
ℹ️
|
If you struggle with OTEL configuration, please check this redhat-rhosdt-samples repository. |
This component is currently used only as an aggregator of traces for Distributed Tracing, so it is deployed together. Please, continue to the new section to see how.
If you arrived here and still don’t know why you should add this component to your Observability architecture, here I have some good use cases:
-
Convert signals between protocols (zipkin -→ OTel/Jaeger etc).
-
Add, filter or transform attributes in the spans.
-
Create secondary metrics based on spans or others.
-
Easily change endpoints with just changing the config in the collector (take into account that normally an application will be also sending metrics, logs and traces to a collector).
-
Do some batching, sampling, etc.
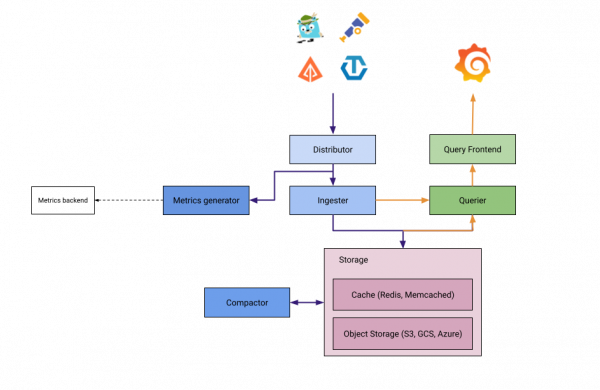
Red Hat OpenShift Distributed Tracing lets you perform distributed tracing, which records the path of a request through various microservices that make up an application. Tempo is split into several components deployed as different microservices. The following diagram from this blog will help you to better understand the architecture:
For more context about Dist Tracing, I strongly recommend reading the following blogs:
For more information, check the official documentation.
You con deploy Grafana Tempo and OpenTelemetry using the following ArgoCD application:
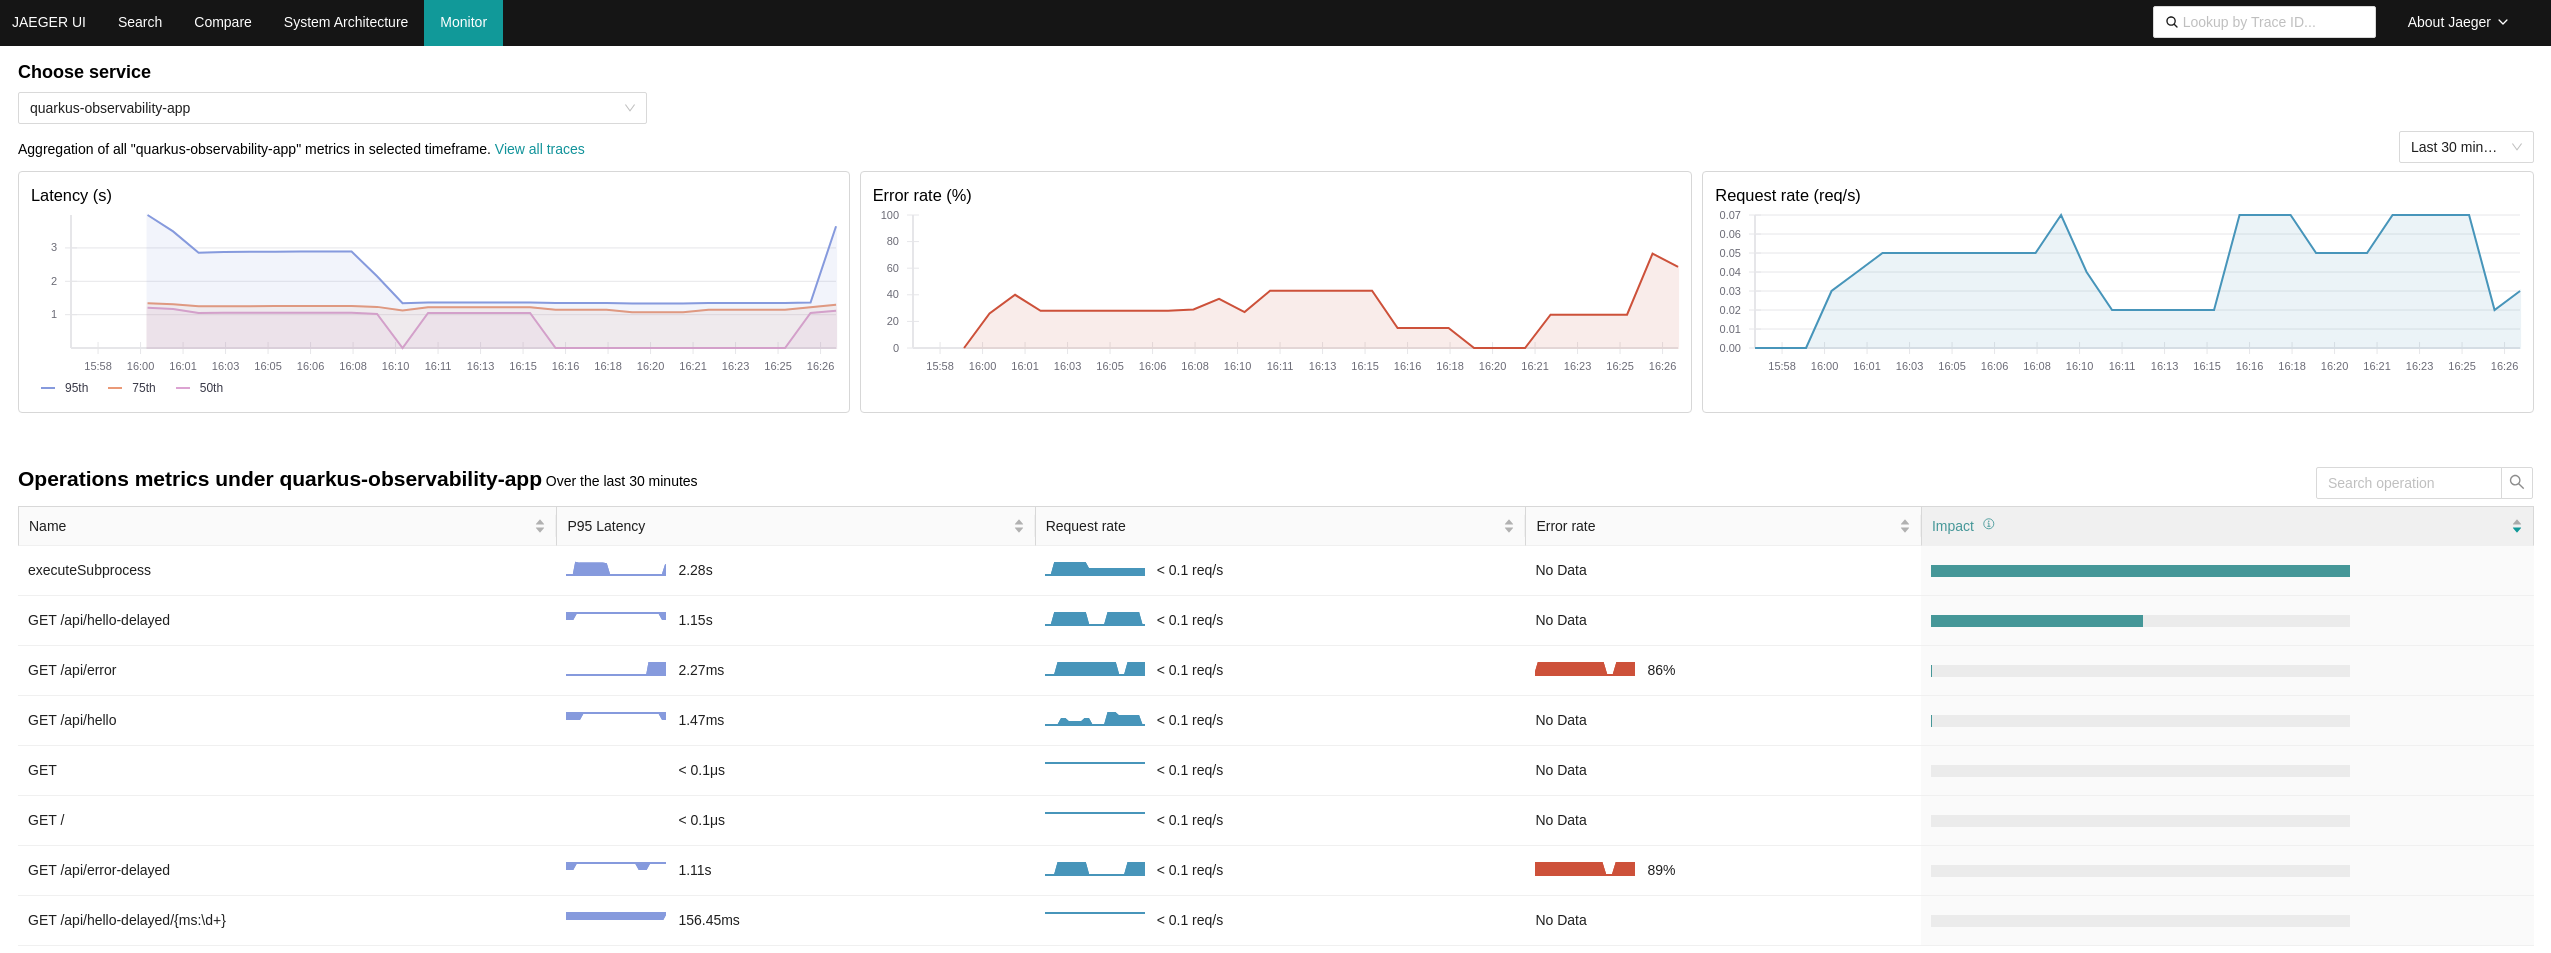
oc apply -f apps/application-ocp-dist-tracing.yamlOnce you have configured everything, you can access the Metrics tab and show stats retrieved directly from the Traces collected by the OpenTelemetry collector. This is an example of the output:
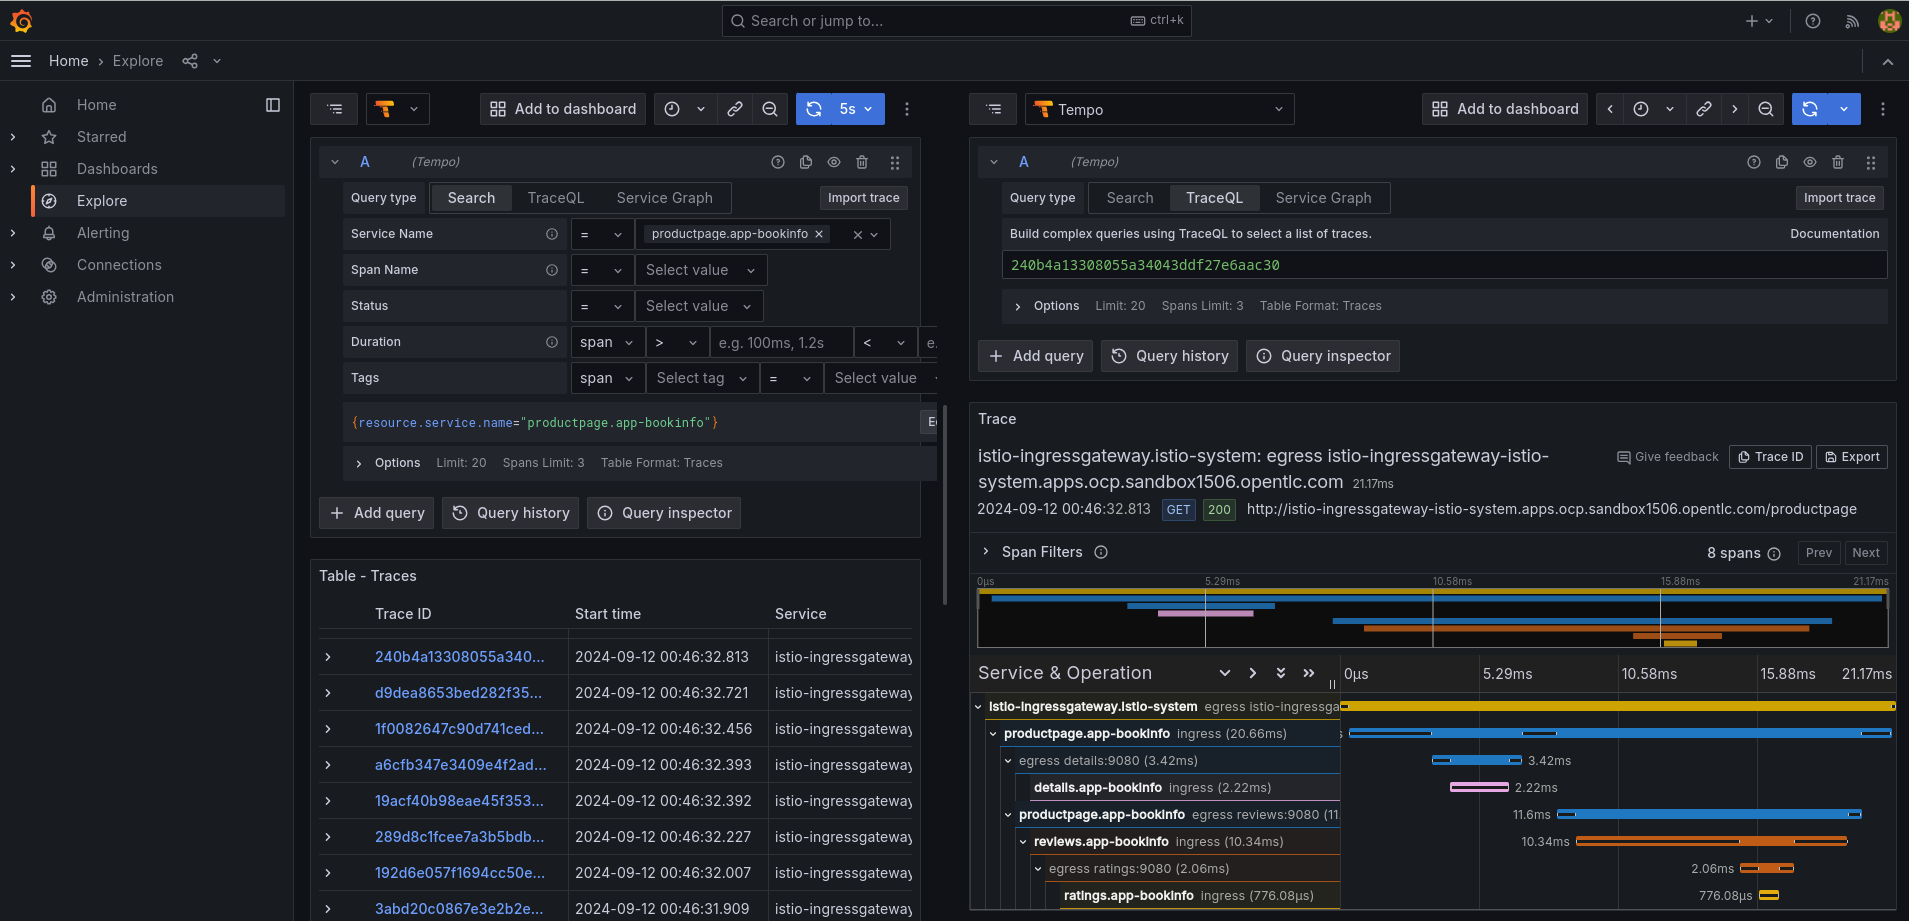
At this point, you might consider that this is good enough, but there is more! As you are already watching application metrics on Grafana, you will probably also want to check traces on the same page. If this is the case, you are lucky!! With the previous ArgoCD application, you are also creating a new Datasource of type tempo pointing directly to the Grafana Tempo instance so that we can query traces from Grafana.
Go to the Grafana instance, click on Explore and then select the Tempo datasource, you will see all your traces like in the following picture:
By default, the Grafana Tempo operator does not configure or provide any Grafana Dashboards for monitoring. Therefore, I have collected the ones provided upstream in this folder: https://github.com/grafana/tempo/tree/main/operations/tempo-mixin-compiled. They are deployed together in the same Grafana instance. This article explains the purpose of each of the dashboards.
|
❗
|
If you see concerning metrics, you have a troubleshooting guide based on those metrics in here. |
In OpenShift Container Platform 4.16, you can enable monitoring for user-defined projects in addition to the default platform monitoring. You can monitor your own projects in OpenShift Container Platform without the need for an additional monitoring solution. In this section we only configure the components, but we don’t set up the monitoring of the application using a ServiceMonitor. This is done in the application section:
oc apply -f apps/application-ocp-monitoring.yamlFor more information, check the official documentation.
|
ℹ️
|
If you face issues creating and configuring the Service monitor, you can use this Thoubleshooting guide. |
Using Openshift Metrics, it is really simple to add alerts based on those Prometheus Metrics:
oc apply -f apps/application-ocp-alerting.yamlThe logging subsystem aggregates infrastructure and applications logs from throughout your cluster and stores them in a default log store. The Openshift Logging installation consists on installing first the Cluster Logging Operator, the Loki Operator and configuring them.
|
ℹ️
|
The Openshift Logging team decided to move from EFK to Vector+Loki. The original Openshift Logging Stack was split into three products: ElasticSearch ( Log Store and Search), Fluentd (Collection and Transportation), and Kibana (Visualization). Now, there will be only two: Vector (Collection) and Loki (Store). |
oc apply -f apps/application-ocp-logging.yamlBy default, the logging subsystem sends container and infrastructure logs to the default internal log store based on Loki. Administrators can create ClusterLogForwarder resources that specify which logs are collected, how they are transformed, and where they are forwarded to.
ClusterLogForwarder resources can be used up to forward container, infrastructure, and audit logs to specific endpoints within or outside of a cluster. Transport Layer Security (TLS) is supported so that log forwarders can be configured to send logs securely.
In the current implementation, the CLF only enables audit logs on the default Loki store. It is possible to configure other stuff like sending logs to the AWS Cloudwatch service. If you want to do so, please, check the CLF definition gitops/ocp-logging/clusterlogforwarder-instance.yaml and uncomment the sections related to Cloudwatch. You will need the infrastructureName that can be retrieved using the following command and you will need to add it to .spec.outputs.cloudwatch.groupPrefix:
oc get Infrastructure/cluster -o=jsonpath='{.status.infrastructureName}'Now, you can check the logs in Cloudwatch using the following command:
source aws-env-vars
aws --output json logs describe-log-groups --region=$AWS_DEFAULT_REGIONAs you may already know, you can define network policies that restrict traffic to pods in your cluster. When the cluster is empty and your applications don’t rely on other Openshift components, this is easy to configure. However, when you add the full observability stack plus extra common services, it can get tricky. That’s why I would like to summarize some of the common NetworkPolicies:
# Here you will deny all traffic except for Routes, Metrics, and webhook requests.
oc process -f openshift/ocp-network-policies/10-basic-network-policies.yaml | oc apply -f -
For other NetworkPolicy configurations, check the official documentation.
Pipelines as code allow to define CI/CD in a file located in git. This file is then used to automatically create a pipeline for a Pull Request or a Push to a branch.
This step automates all the steps in this section of the documentation:
-
Create an application in GitHub with the configuration of the cluster.
-
Create a secret in Openshift with the configuration of the GH App
pipelines-as-code-secret.
tkn pac bootstrap
# In the interactive menu, set the application name to "pipelines-as-code-app"It is possible to use Labels to set the automatic expiration of individual image tags in Quay. In order to test that, I just added a new dockerfile that takes an image as a build argument and labels it with a set expiration time.
podman build -f src/main/docker/Dockerfile.add-expiration \
    --build-arg IMAGE_NAME=quay.io/alopezme/quarkus-observability-app \
    --build-arg IMAGE_TAG=latest-micro \
    --build-arg EXPIRATION_TIME=2h \
-t quay.io/alopezme/quarkus-observability-app:expiration-test .# Nothing related to expiration:
podman inspect image --format='{{json .Config.Labels}}' quay.io/alopezme/quarkus-observability-app:latest-micro | jq
# Adds expiration label:
podman inspect image --format='{{json .Config.Labels}}' quay.io/alopezme/quarkus-observability-app:expiration-test | jq