This is a Prometheus exporter for CAKE-autorate stats.
Once CAKE-autorate is running, to setup this exporter
- Install
python3andpython3-pip
opkg update
opkg install python3 python3-pip- Install
prometheus-client
pip install prometheus-client- Download the exporter
cd /root
wget https://raw.githubusercontent.com/bairhys/prometheus-cake-autorate-exporter/main/prometheus_cake_autorate_exporter.py- Start exporter manually
python prometheus_cake_autorate_exporter.py- Test to determine if metrics accessible. In a browser, try accessing http://192.168.1.1:9101/, should see raw metrics like below
# HELP python_gc_objects_collected_total Objects collected during gc
# TYPE python_gc_objects_collected_total counter
python_gc_objects_collected_total{generation="0"} 391.0
python_gc_objects_collected_total{generation="1"} 7.0
python_gc_objects_collected_total{generation="2"} 0.0
# HELP python_gc_objects_uncollectable_total Uncollectable object found during GC
# TYPE python_gc_objects_uncollectable_total counter
python_gc_objects_uncollectable_total{generation="0"} 0.0
python_gc_objects_uncollectable_total{generation="1"} 0.0
python_gc_objects_uncollectable_total{generation="2"} 0.0
# HELP python_gc_collections_total Number of times this generation was collected
# TYPE python_gc_collections_total counter
python_gc_collections_total{generation="0"} 41.0
python_gc_collections_total{generation="1"} 3.0
python_gc_collections_total{generation="2"} 0.0
# HELP python_info Python platform information
# TYPE python_info gauge
python_info{implementation="CPython",major="3",minor="10",patchlevel="9",version="3.10.9"} 1.0
# HELP process_virtual_memory_bytes Virtual memory size in bytes.
# TYPE process_virtual_memory_bytes gauge
process_virtual_memory_bytes 2.3035904e+07
# HELP process_resident_memory_bytes Resident memory size in bytes.
# TYPE process_resident_memory_bytes gauge
process_resident_memory_bytes 1.8558976e+07
# HELP process_start_time_seconds Start time of the process since unix epoch in seconds.
# TYPE process_start_time_seconds gauge
process_start_time_seconds 1.68233547037e+09
# HELP process_cpu_seconds_total Total user and system CPU time spent in seconds.
# TYPE process_cpu_seconds_total counter
process_cpu_seconds_total 1.31
# HELP process_open_fds Number of open file descriptors.
# TYPE process_open_fds gauge
process_open_fds 6.0
# HELP process_max_fds Maximum number of open file descriptors.
# TYPE process_max_fds gauge
process_max_fds 1024.0
# HELP cake_autorate_data_header_enum Log Type
# TYPE cake_autorate_data_header_enum gauge
cake_autorate_data_header_enum{cake_autorate_data_header_enum="DATA"} 1.0
cake_autorate_data_header_enum{cake_autorate_data_header_enum="LOAD"} 0.0
cake_autorate_data_header_enum{cake_autorate_data_header_enum="SHAPER"} 0.0
# HELP cake_autorate_log_timestamp_seconds Log timestamp (seconds)
# TYPE cake_autorate_log_timestamp_seconds gauge
cake_autorate_log_timestamp_seconds 1.682335481435921e+09
# HELP cake_autorate_proc_timestamp_seconds Process time (seconds)
# TYPE cake_autorate_proc_timestamp_seconds gauge
cake_autorate_proc_timestamp_seconds 1.68233548143526e+09
# HELP cake_autorate_dl_achieved_rate_bits_per_second Measured download rate (bits/second)
# TYPE cake_autorate_dl_achieved_rate_bits_per_second gauge
cake_autorate_dl_achieved_rate_bits_per_second 1.7627e+07
# HELP cake_autorate_ul_achieved_rate_bits_per_second Measured upload rate (bits/second)
# TYPE cake_autorate_ul_achieved_rate_bits_per_second gauge
cake_autorate_ul_achieved_rate_bits_per_second 162000.0
# HELP cake_autorate_dl_load_percent Download load (percent)
# TYPE cake_autorate_dl_load_percent gauge
cake_autorate_dl_load_percent 47.0
# HELP cake_autorate_ul_load_percent Upload load (percent)
# TYPE cake_autorate_ul_load_percent gauge
cake_autorate_ul_load_percent 4.0
# HELP cake_autorate_rtt_timestamp_seconds Round Trip Time Timestamp (seconds)
# TYPE cake_autorate_rtt_timestamp_seconds gauge
cake_autorate_rtt_timestamp_seconds 1.68233548141966e+09
# HELP cake_autorate_reflector_info Reflector target address
# TYPE cake_autorate_reflector_info gauge
cake_autorate_reflector_info{address="1.1.1.1"} 1.0
# HELP cake_autorate_sequence Sequence
# TYPE cake_autorate_sequence gauge
cake_autorate_sequence 2315.0
# HELP cake_autorate_dl_owd_baseline_seconds (seconds)
# TYPE cake_autorate_dl_owd_baseline_seconds gauge
cake_autorate_dl_owd_baseline_seconds 0.008806
# HELP cake_autorate_dl_owd_seconds (seconds)
# TYPE cake_autorate_dl_owd_seconds gauge
cake_autorate_dl_owd_seconds 0.0118
# HELP cake_autorate_dl_owd_delta_ewma_seconds (seconds)
# TYPE cake_autorate_dl_owd_delta_ewma_seconds gauge
cake_autorate_dl_owd_delta_ewma_seconds 0.00487
# HELP cake_autorate_dl_owd_delta_seconds (seconds)
# TYPE cake_autorate_dl_owd_delta_seconds gauge
cake_autorate_dl_owd_delta_seconds 0.002993
# HELP cake_autorate_dl_adj_delay_thr_seconds (seconds)
# TYPE cake_autorate_dl_adj_delay_thr_seconds gauge
cake_autorate_dl_adj_delay_thr_seconds 0.03004
# HELP cake_autorate_ul_owd_baseline_seconds (seconds)
# TYPE cake_autorate_ul_owd_baseline_seconds gauge
cake_autorate_ul_owd_baseline_seconds 0.008806
# HELP cake_autorate_ul_owd_seconds (seconds)
# TYPE cake_autorate_ul_owd_seconds gauge
cake_autorate_ul_owd_seconds 0.0118
# HELP cake_autorate_ul_owd_delta_ewma_seconds (seconds)
# TYPE cake_autorate_ul_owd_delta_ewma_seconds gauge
cake_autorate_ul_owd_delta_ewma_seconds 0.00487
# HELP cake_autorate_ul_owd_delta_seconds (seconds)
# TYPE cake_autorate_ul_owd_delta_seconds gauge
cake_autorate_ul_owd_delta_seconds 0.002993
# HELP cake_autorate_ul_adj_delay_thr_seconds (seconds)
# TYPE cake_autorate_ul_adj_delay_thr_seconds gauge
cake_autorate_ul_adj_delay_thr_seconds 0.030375
# HELP cake_autorate_sum_dl_delays_seconds Total download delays (seconds)
# TYPE cake_autorate_sum_dl_delays_seconds gauge
cake_autorate_sum_dl_delays_seconds 0.0
# HELP cake_autorate_sum_ul_delays_seconds Total upload delays (seconds)
# TYPE cake_autorate_sum_ul_delays_seconds gauge
cake_autorate_sum_ul_delays_seconds 0.0
# HELP cake_autorate_dl_load_condition_enum Download state
# TYPE cake_autorate_dl_load_condition_enum gauge
cake_autorate_dl_load_condition_enum{cake_autorate_dl_load_condition_enum="dl_idle"} 0.0
cake_autorate_dl_load_condition_enum{cake_autorate_dl_load_condition_enum="dl_idle_bb"} 0.0
cake_autorate_dl_load_condition_enum{cake_autorate_dl_load_condition_enum="dl_low"} 1.0
cake_autorate_dl_load_condition_enum{cake_autorate_dl_load_condition_enum="dl_low_bb"} 0.0
cake_autorate_dl_load_condition_enum{cake_autorate_dl_load_condition_enum="dl_high"} 0.0
cake_autorate_dl_load_condition_enum{cake_autorate_dl_load_condition_enum="dl_high_bb"} 0.0
# HELP cake_autorate_ul_load_condition_enum Upload state
# TYPE cake_autorate_ul_load_condition_enum gauge
cake_autorate_ul_load_condition_enum{cake_autorate_ul_load_condition_enum="ul_idle"} 1.0
cake_autorate_ul_load_condition_enum{cake_autorate_ul_load_condition_enum="ul_idle_bb"} 0.0
cake_autorate_ul_load_condition_enum{cake_autorate_ul_load_condition_enum="ul_low"} 0.0
cake_autorate_ul_load_condition_enum{cake_autorate_ul_load_condition_enum="ul_low_bb"} 0.0
cake_autorate_ul_load_condition_enum{cake_autorate_ul_load_condition_enum="ul_high"} 0.0
cake_autorate_ul_load_condition_enum{cake_autorate_ul_load_condition_enum="ul_high_bb"} 0.0
# HELP cake_autorate_cake_dl_rate_bits_per_second CAKE download rate (bits/sec)
# TYPE cake_autorate_cake_dl_rate_bits_per_second gauge
cake_autorate_cake_dl_rate_bits_per_second 3.6641e+07
# HELP cake_autorate_cake_ul_rate_bits_per_second CAKE upload rate (bits/sec)
# TYPE cake_autorate_cake_ul_rate_bits_per_second gauge
cake_autorate_cake_ul_rate_bits_per_second 4e+06-
Stop running exporter manually (Ctrl+C)
-
Setup service
wget -P /etc/init.d/ https://raw.githubusercontent.com/bairhys/prometheus-cake-autorate-exporter/main/prometheus-node-exporter-cake-autorate
chmod +x /etc/init.d/prometheus-node-exporter-cake-autorate- Enable and start service
service prometheus-node-exporter-cake-autorate enable
service prometheus-node-exporter-cake-autorate start- Test to determine if metrics accessible as a service. In a browser, try accessing http://192.168.1.1:9101/, should see raw metrics again like above
If you don't already have Prometheus set up to scrape the CAKE Autorate metrics, setup Prometheus to run on your server
-
create Prometheus config file
prometheus.yml -
copy example below into
prometheus.yml, replacing192.168.1.1:9101with the IP address and port of your exporter.# my global config global: scrape_interval: 15s # Set the scrape interval to every 15 seconds. Default is every 1 minute. evaluation_interval: 15s # Evaluate rules every 15 seconds. The default is every 1 minute. # scrape_timeout is set to the global default (10s). # A scrape configuration containing exactly one endpoint to scrape: # Here it's Prometheus itself. scrape_configs: # The job name is added as a label `job=<job_name>` to any timeseries scraped from this config. - job_name: "prometheus" static_configs: - targets: ["localhost:9090"] - job_name: 'router_cake_autorate' scrape_interval: 3s metrics_path: /metrics static_configs: - targets: ["192.168.1.1:9101"]
-
Run Prometheus docker container by replacing
/path/to/prometheus.ymlto point to theprometheus.ymljust createddocker run \ -d \ --restart unless-stopped \ -p 9090:9090 \ -v /path/to/prometheus.yml:/etc/prometheus/prometheus.yml \ prom/prometheus
To see if Prometheus is scraping the exporter, go to Prometheus targets page http://your-prometheus-ip:9090/targets and look for UP for router_cake_autorate job.
If you don't already have Grafana set up, setup Grafana to run on your server
-
run Grafana
docker run \ -d \ --restart unless-stopped \ -p 3000:3000 \ grafana/grafana-oss -
Go to Grafana http://your-grafana-ip:3000 (might take a few minutes first run). Use admin:admin to log in
-
Go to http://your-grafana-ip:3000/datasources
- add Prometheus datasource
- Set Prometheus URL
http://<your-prometheus-ip>:9090 - Click
Save and Testto check if connected
-
Go to http://your-grafana-ip:3000/dashboards
- New -> Import
- Enter in
Import via grafana.com:18597(id can be found at Grafana Dashboard) and click Load - Set the datasource as Prometheus instance set up before then click Import
-
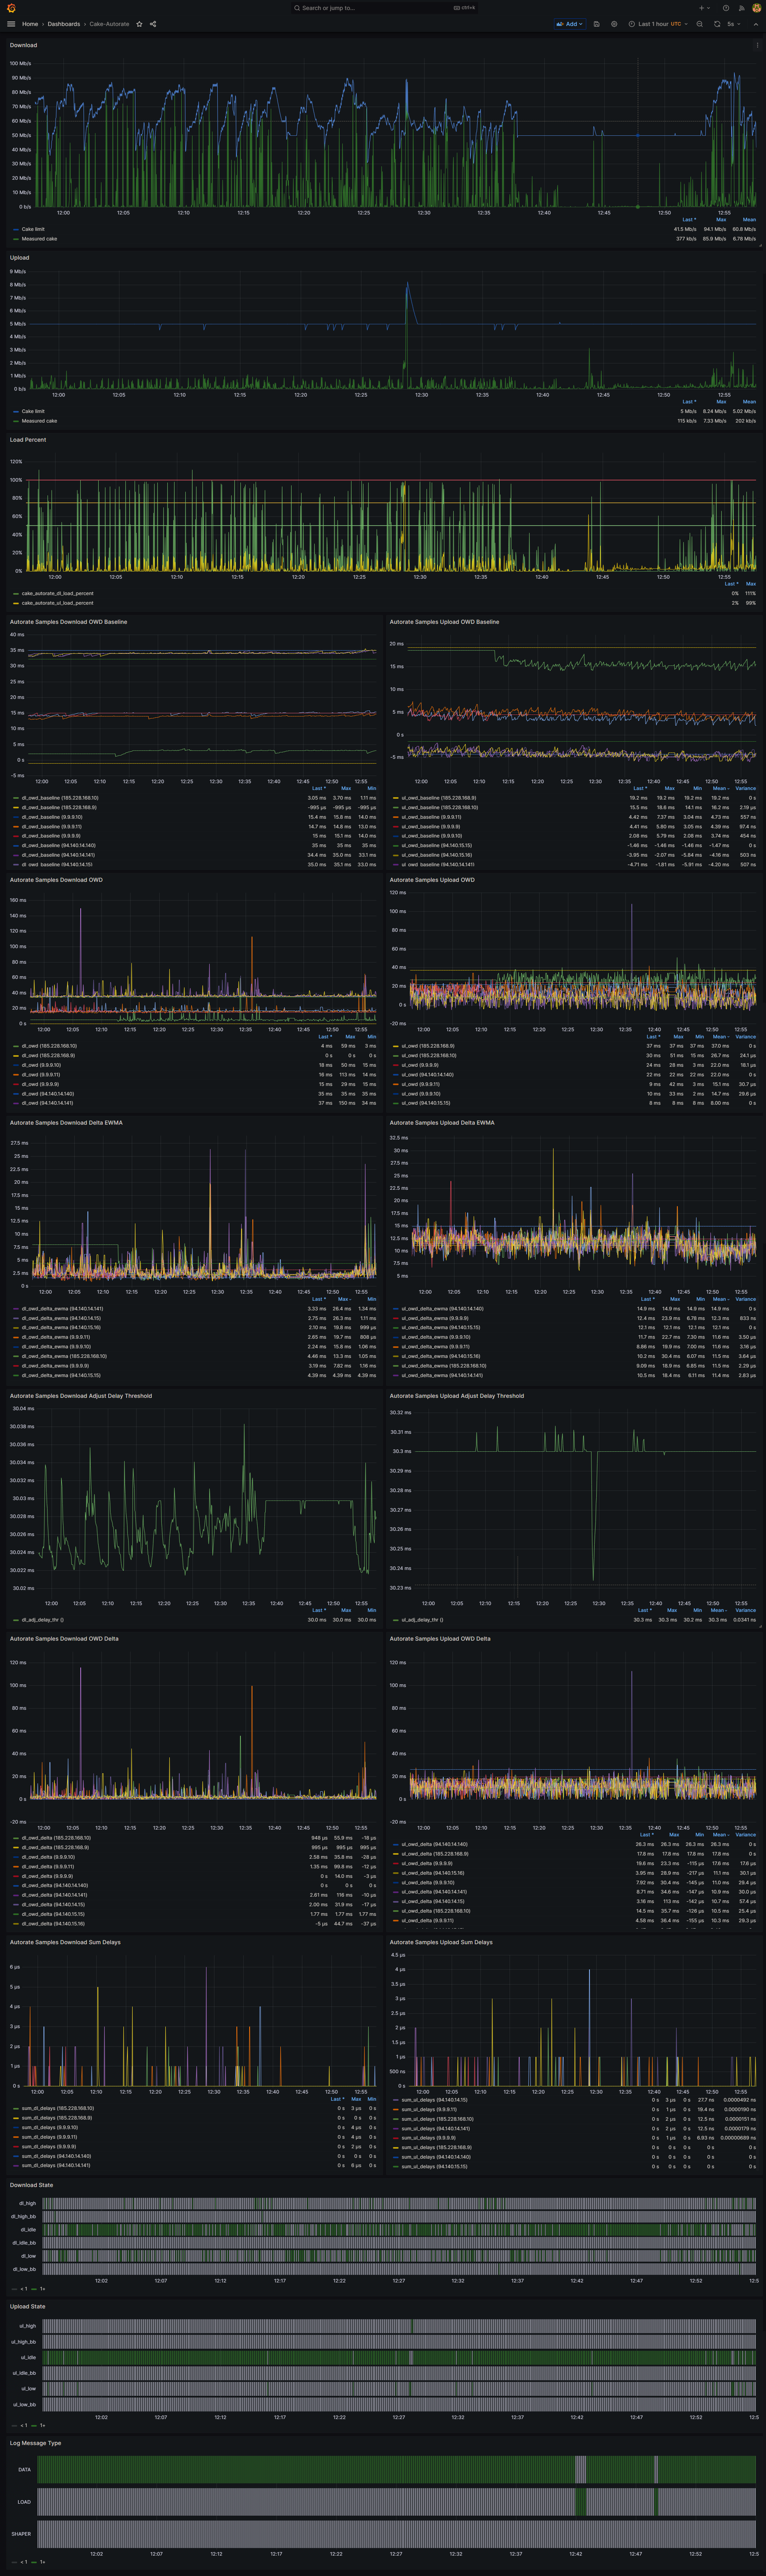
Should now be able to see CAKE Autorate time series metrics in the Grafana dashboard