This tool is used to analysize Linux/Solaris/BSD kernel. It can draw callgraphs of your specific function, and help you understand the code. I hope you could like it.
-
Debian
apt-get install -y systemtap linux-image-`uname -r`-dbg linux-headers-`uname -r` graphvize -
Solaris
pkg install graphvize
The gen_stap.sh tool is used to generate systemtap scripts for advanced feature like probing more modules. You could add '-m' with modules name. For instance, add '-m target_core_mod.ko,iscsi_target_mod.ko,target_core_file.ko' for probing target core module, iscsi module and file-based backstore target module.
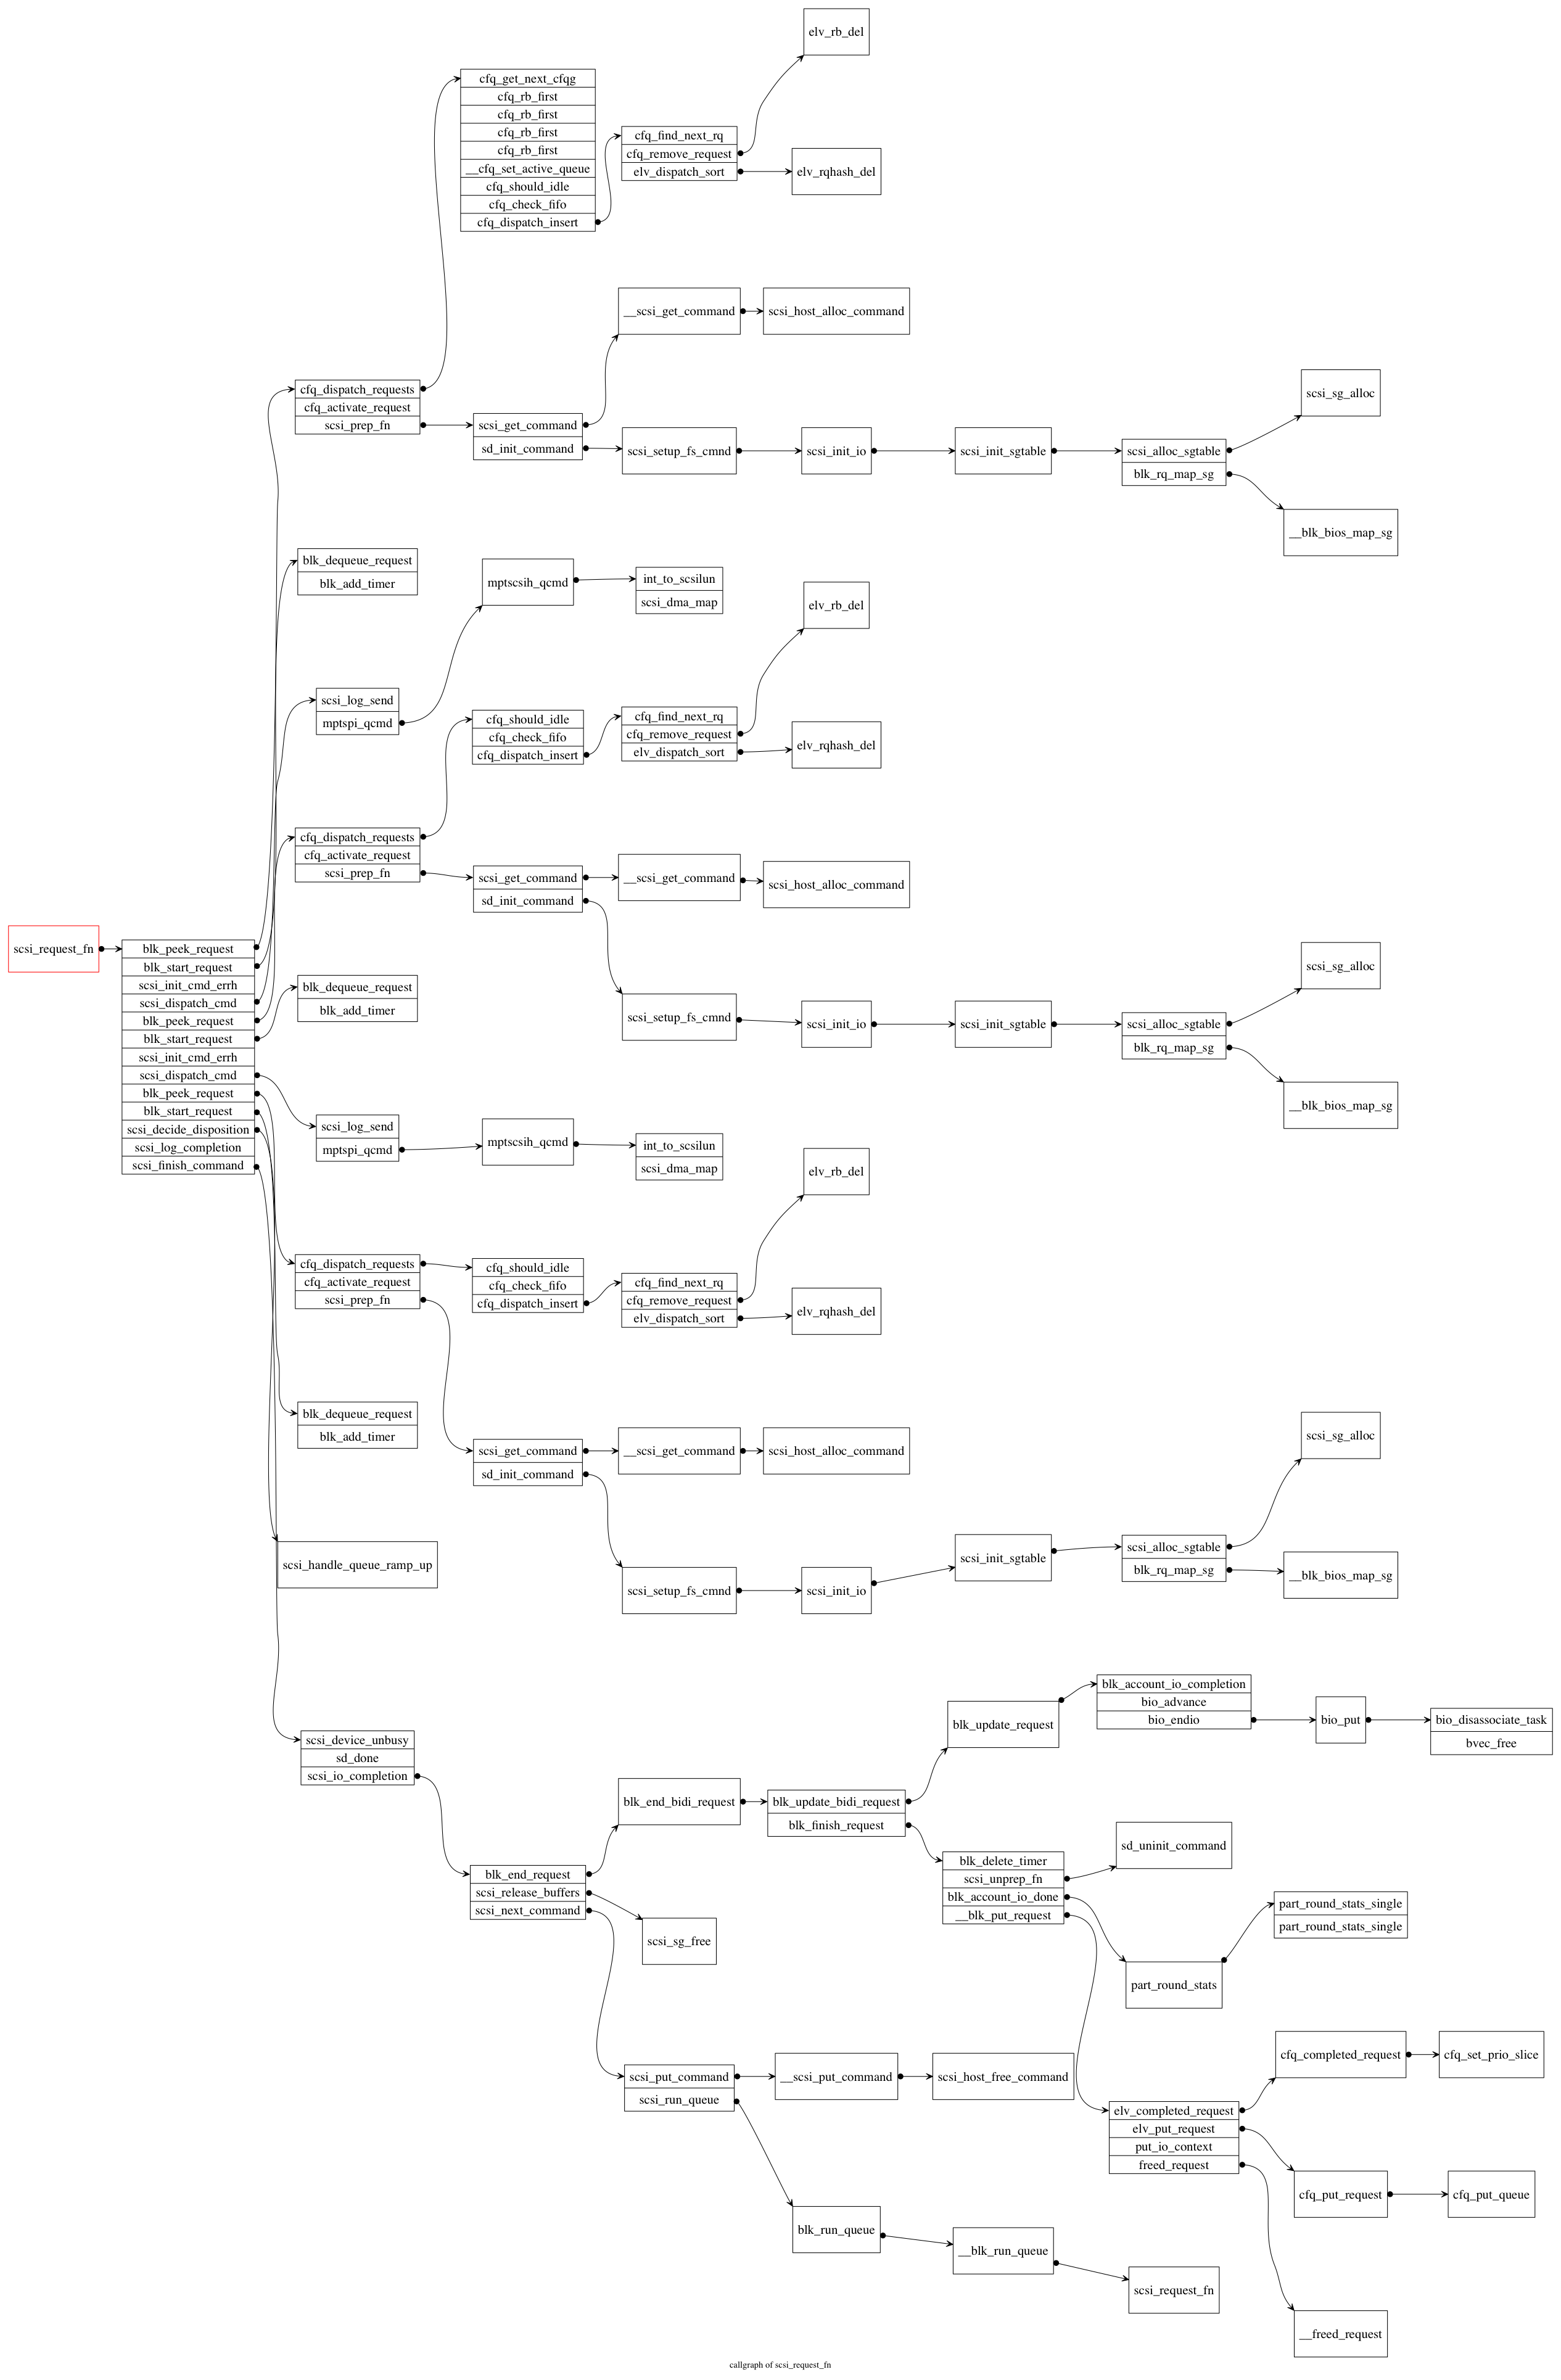
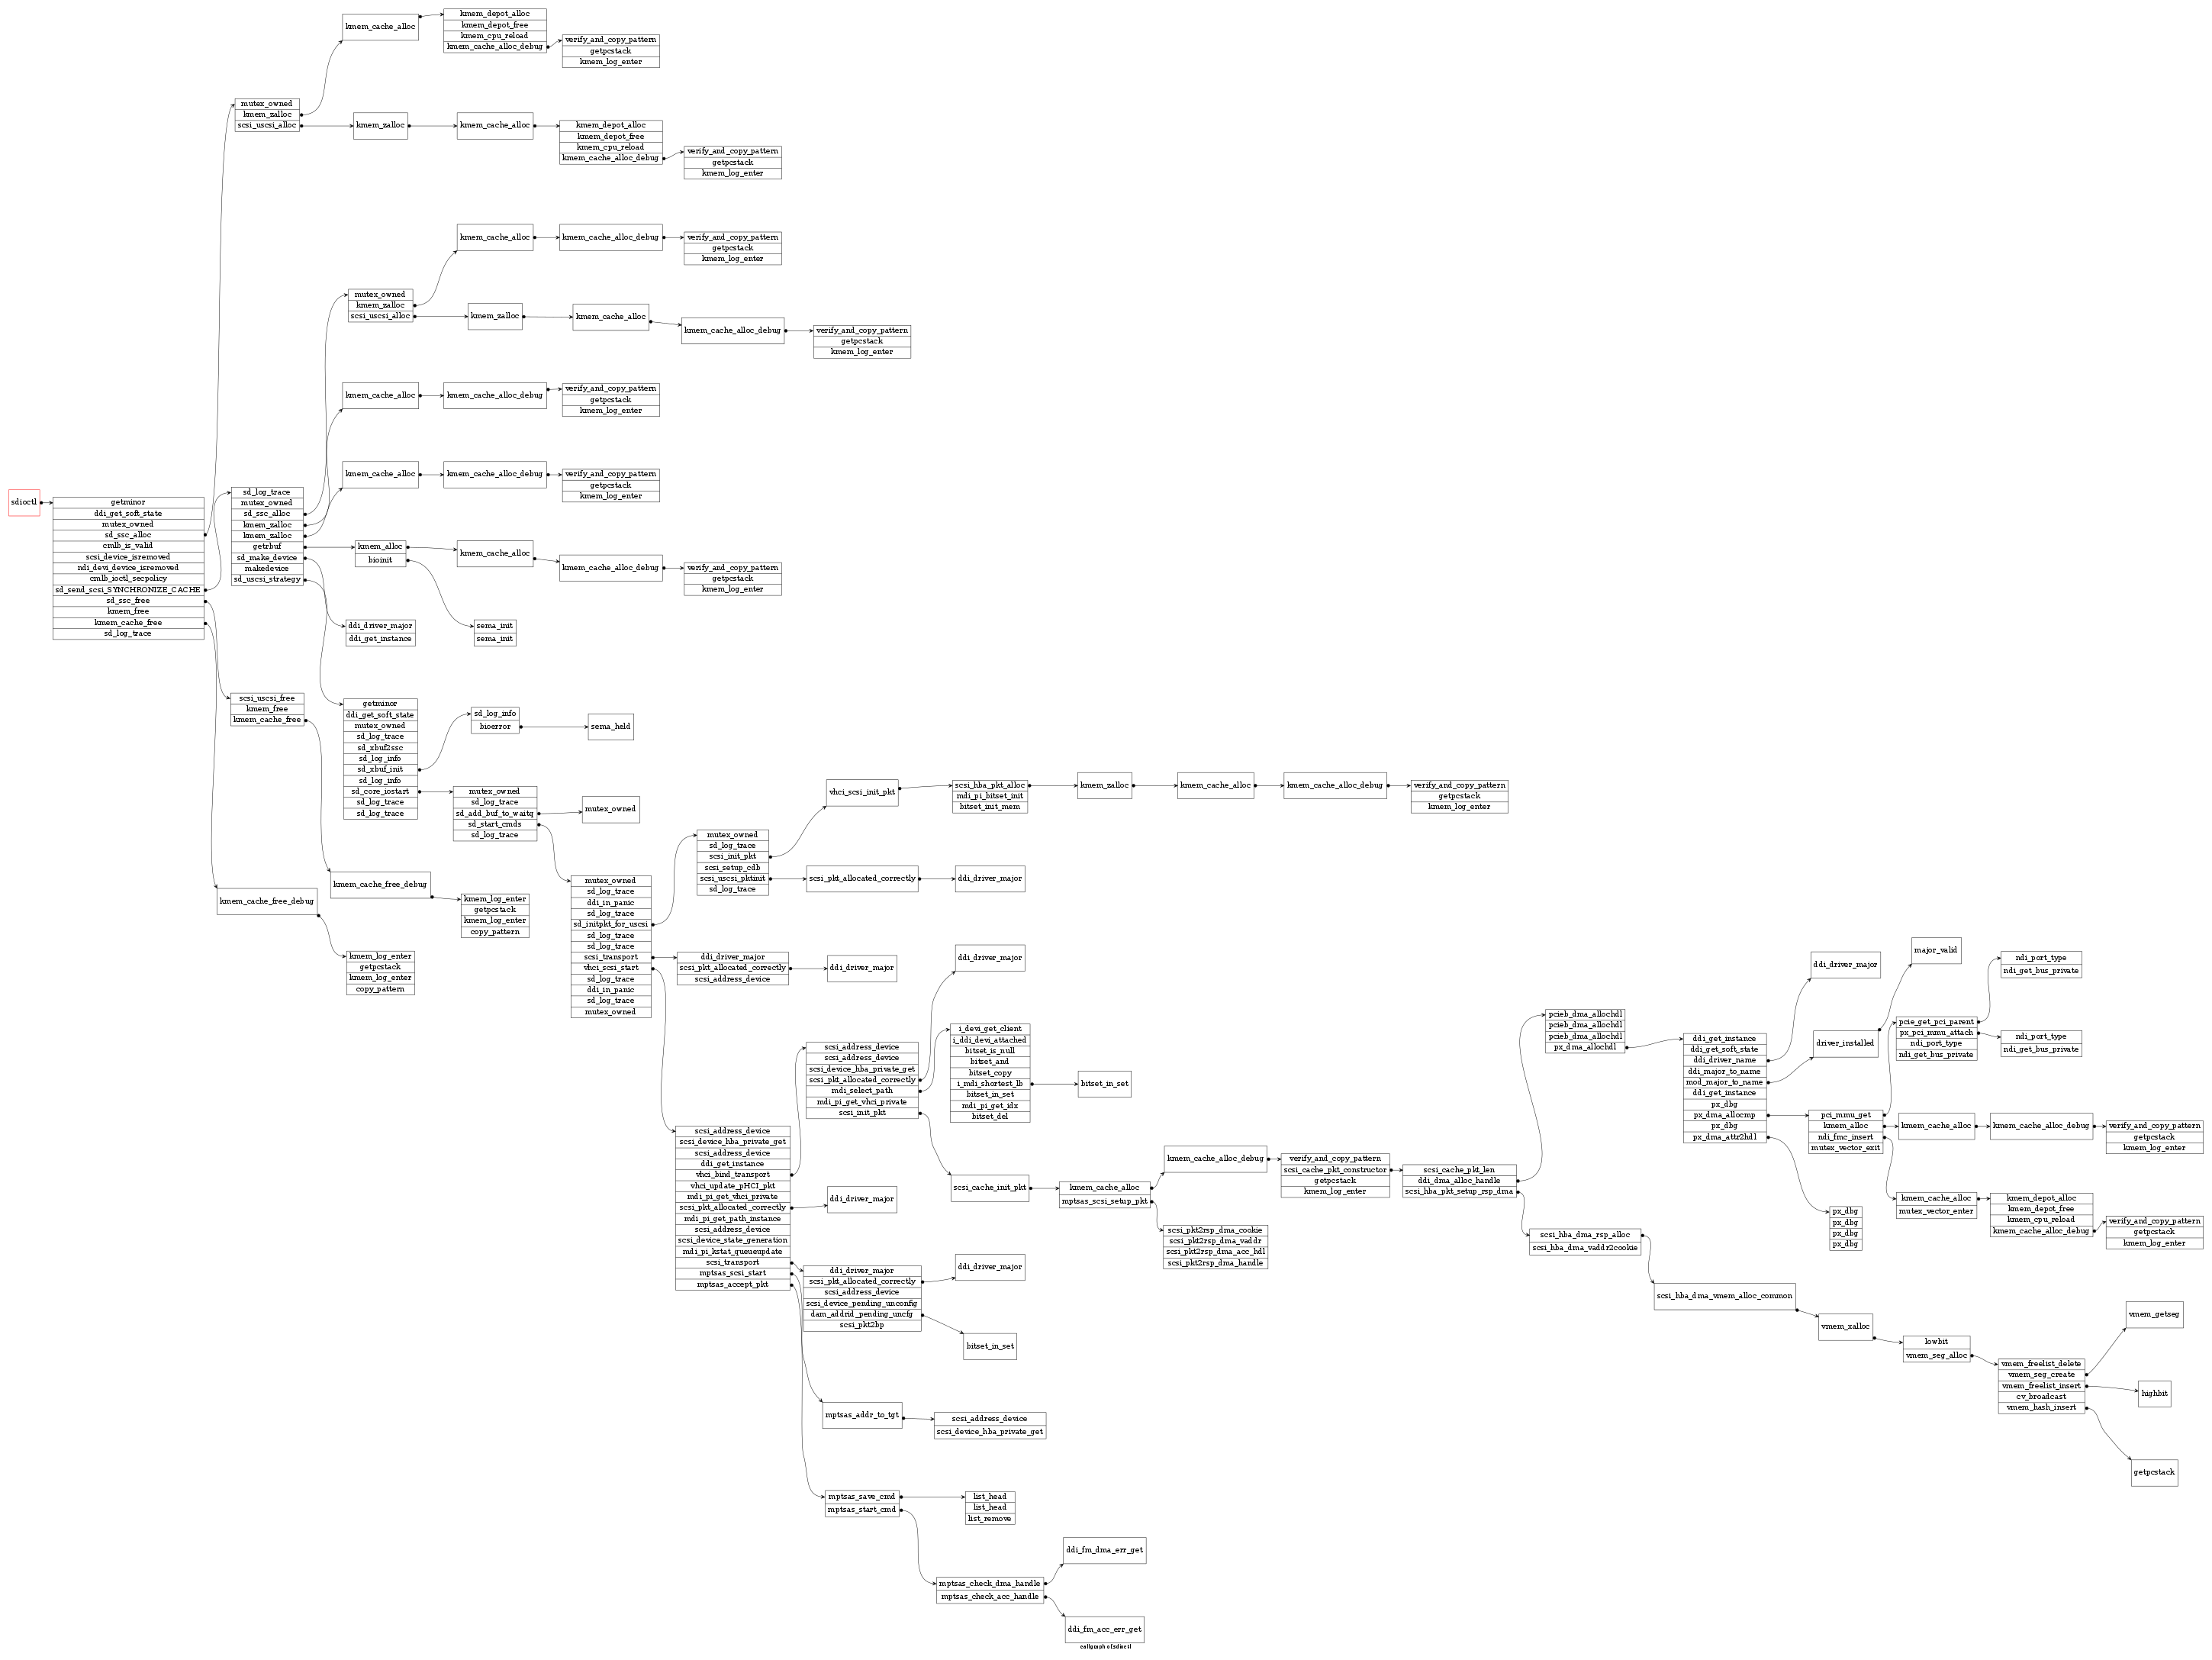
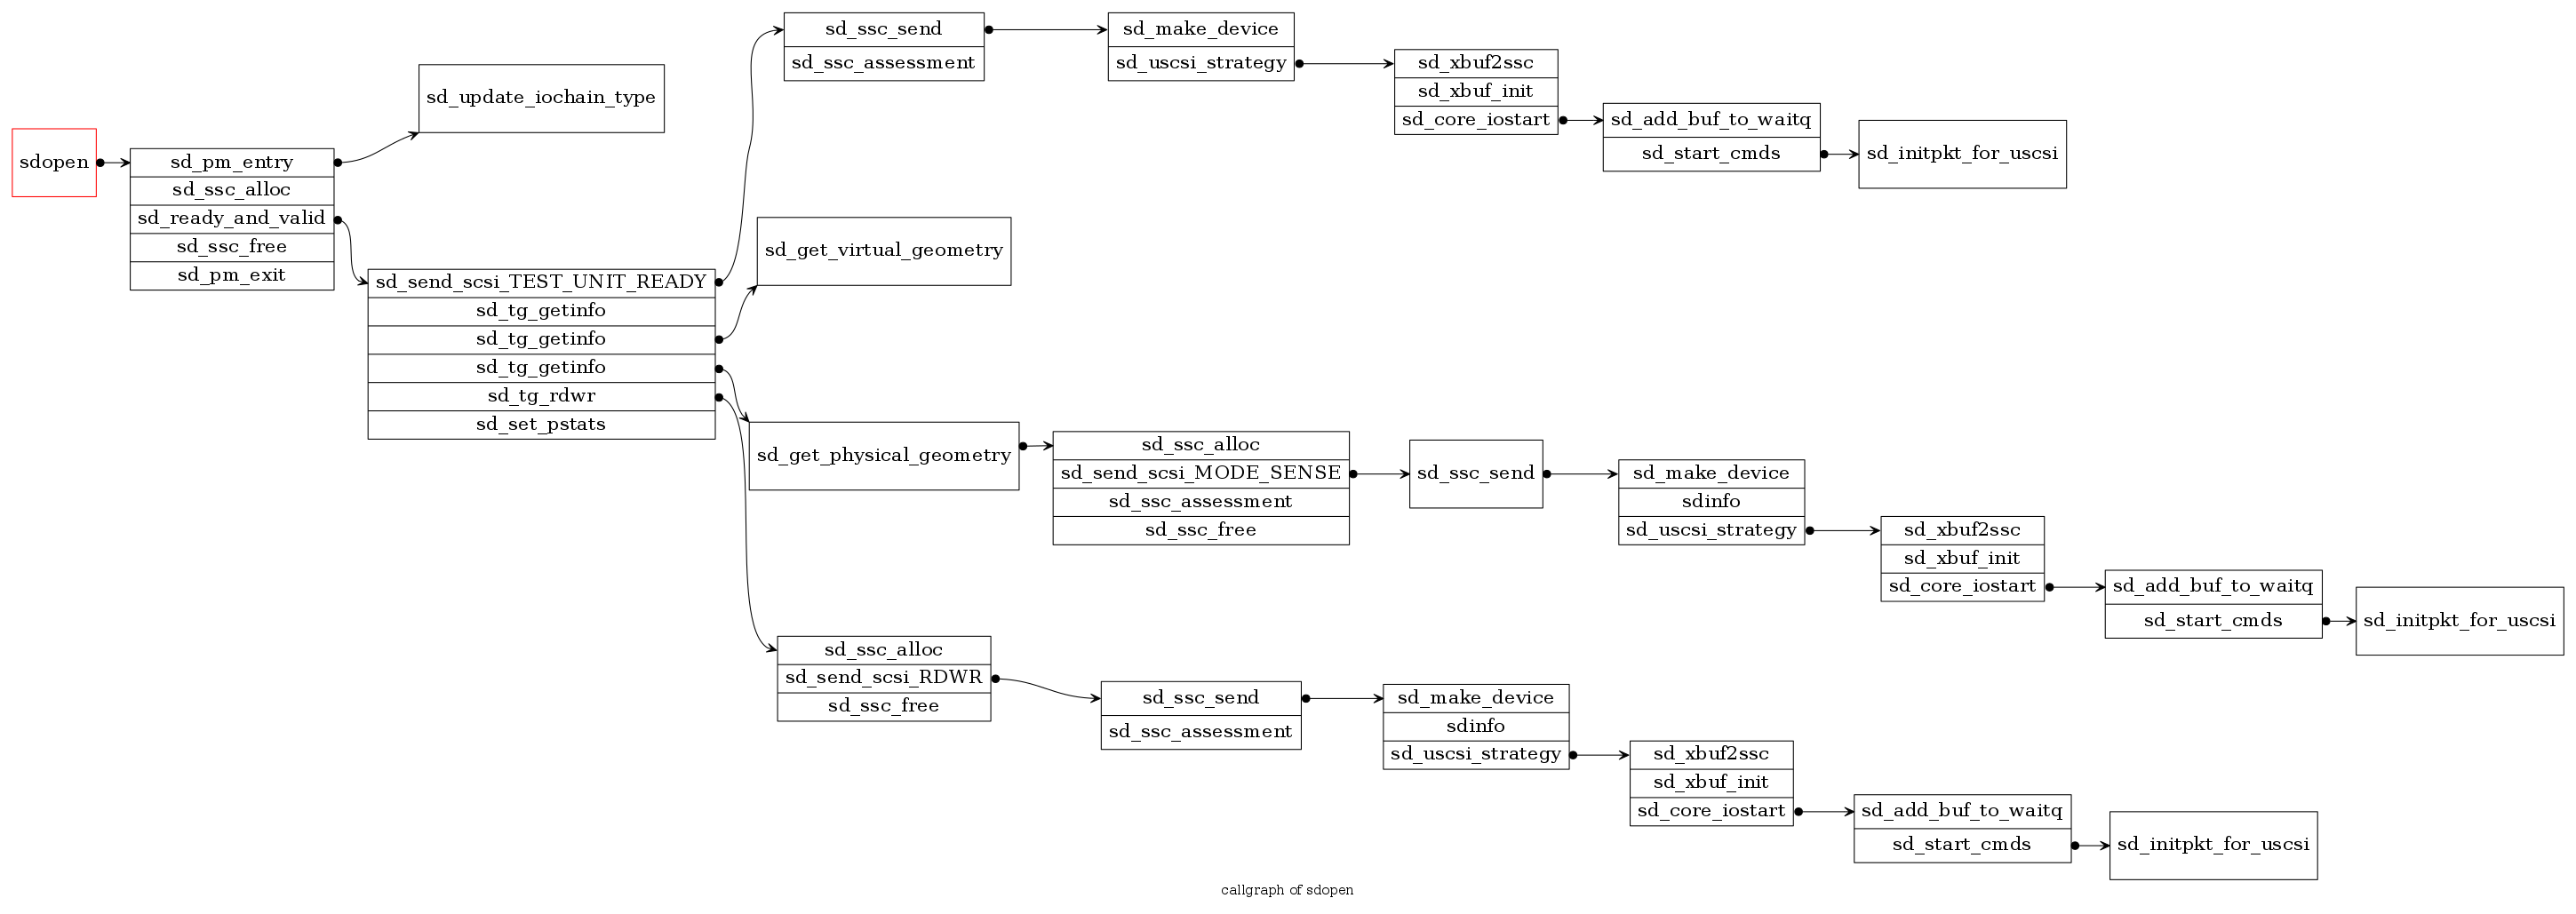
You could do as you need to generate images like these.
- Usage
 $ ./gen_stap.sh -h

Usage:
 -e, --entry func, must options here, you could use module.func style if this function name is ambiguity
 -m, --modules modules, put multi modules splitted with comma(,)
 -k, --kernel_funcs , put multi kernel funcs splitted with comma(,), e.g. *@block/*
 -f, --force_cache
 -o, --out_stap
 -v, --verbose, probe suffix ?
 e.g. ./gen_stap.sh -m iscsi_target_mod.ko,target_core_mod.ko,target_core_file.ko,target_core_pscsi.ko -e fd_do_rw
e.g. ./gen_stap.sh -m iscsi_target_mod.ko,target_core_mod.ko,target_core_file.ko,target_core_pscsi.ko -e iscsi_target_mod.rx_data
e.g. ./gen_stap.sh -m sg,scsi_transport_spi,libata,mptspi,vmw_pvscsi,sd_mod,sr_mod,mptscsih,scsi_mod,scsi_debug -k "*@block/*, *@kernel/*" -e scsi_request_fn
 $ python callee.py -h
Usage: callee.py [options] log_file

Generate pngs from Dtrace or Systemtap log

Options:
  -h, --help            show this help message and exit
  -k, --keep-dot        keep dot file, default delect it
  -o OUTPUT_FORMAT, --output-format=OUTPUT_FORMAT
                        output file format, could be ["png", "jpg", "svg"],
                        default is png
  -d, --is_dtrace_log   default is systemtap log, -d stand for dtrace log
  -c THRESHOLD_CG, --threshold_cg=THRESHOLD_CG
                        only generate call graph when the call link extend to
                        threshold_cg
  -b THRESHOLD_BT, --threshold_bt=THRESHOLD_BT
                        only generate backtrace graph when the call link
                        extend to threshold_bt
  -s, --is_simplify     output simplified version, remove the same node, loop
                        node
- Create stap as your want
$ bash ./gen_stap.sh -m sg,scsi_transport_spi,libata,mptspi,vmw_pvscsi,sd_mod,sr_mod,mptscsih,scsi_mod,scsi_debug -k "*@block/*"  -e scsi_request_fn

[+] Entry func: module("scsi_mod").function("scsi_request_fn")
[+] Inject modules: sg,scsi_transport_spi,libata,mptspi,vmw_pvscsi,sd_mod,sr_mod,mptscsih,scsi_mod,scsi_debug
[+] Inject kernel funcs: *@block/*
[+] Out_stap: scsi_request_fn.stap
[+] Force cache: 0
[+] Probe check: 0
- Run stap
$ bash ./scsi_request_fn.stap -w -v | tee scsi_request_fn.log
- Generate images
./callee.py scsi_request_fn.log -c 5
If you have any trouble, you could try this simply way:
bash stap_base.stp 'module("scsi_mod").function("scsi_request_fn")' 'module("scsi_mod").function("*")' | tee scsi_request_fn.log
-
Run using Dtrace(use
-doption that stands for dtrace log)./dtrace_base.d sdioctl | tee sdioctl.dtrace.log -
Generate images
python callee.py sdioctl.dtrace.log -d
-
In callgraph, from left to right, it presents the throughout program flow which begins from the most left function. It's only one program call path that currently your kernel is running. So this tool is dynamic, not like Doxygen. Doxgen is static analysis. It couldn't give me the whole path.
-
In the same list box of callgraph, it presents its parent call them step by step, one and one. If it enters and calls other functions, you will see that it points to his children.
-
There exists these paths that they have the same root parent, because we are dynamic. The same function could have different path in different context. So I have to add some random number in the output name.
-
You Could go to
example/and play.
Alex Feng [email protected]


