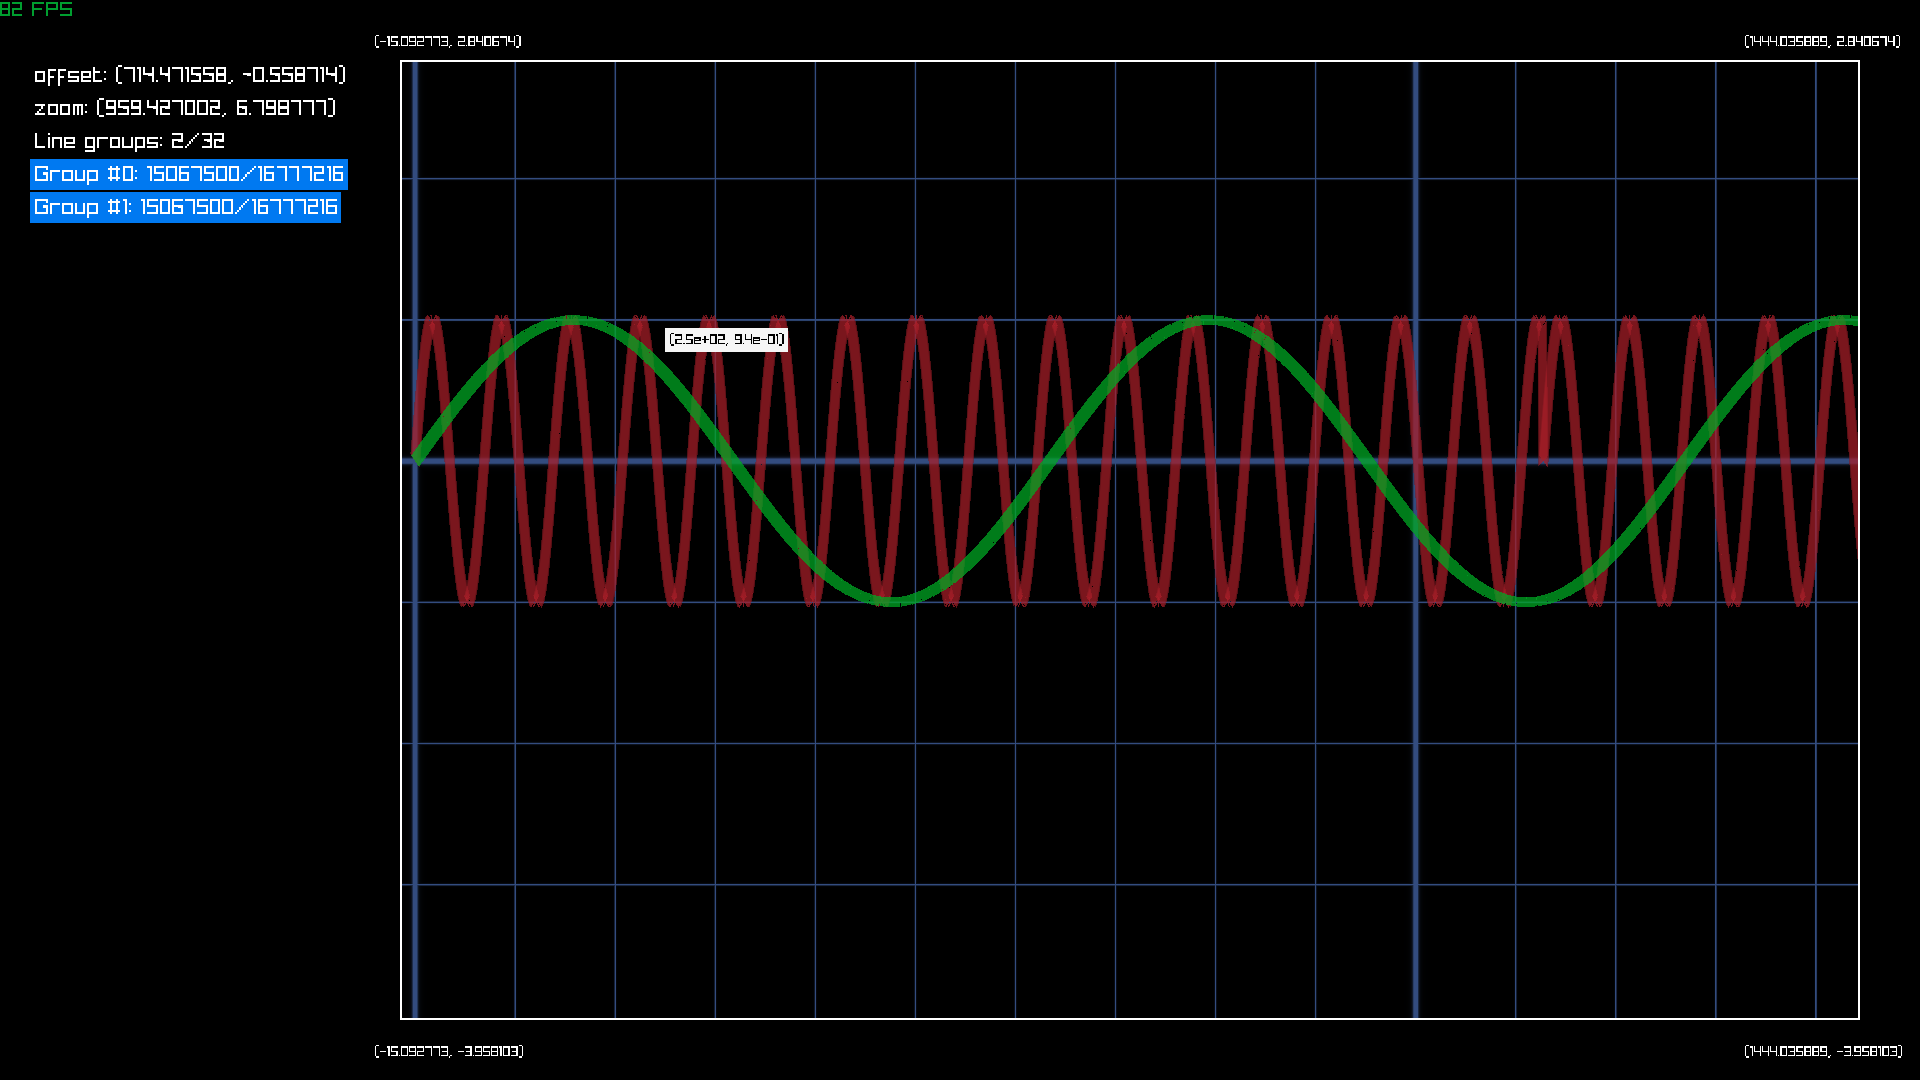
brplot - [b]etter [r]l[plot] Small application that plots lines that are sent to the application's stdin.
brplot is designed in such a way that it plays nicely with other unix tools. You can just pipe the output of your program to brplot and brplot will do it's best to plot your data.
Brplot can be built using GNU make or cmake or use whatever you like. Only tested on linux. Maybe will work on other OSes. But it can cross compile for windows and for webassm.
Tested on 22.04
sudo apt install git make gcc g++ libglfw3-dev pkg-config
git clone https://github.com/branc116/brplot
cd brplot
makeTested on Debian-12
sudo apt install git make gcc g++ libglfw3-dev pkg-config
git clone https://github.com/branc116/brplot
cd brplot
makesudo pacman -Sy base-devel glfw3
git clone https://github.com/branc116/brplot
cd brplot
makeTested on FreeBSD 14.0
pkg install glfw cmake
git clone https://github.com/branc116/brplot
cd brplot
mkdir build
cd build
cmake ..
makeTested on Windows 11
git clone https://github.com/branc116/brplot
cd brplot
zig build
./zig-out/brplot_imgui_windows_ReleaseSafe.exebrew install git zig
git clone https://github.com/branc116/brplot
cd brplot
zig buildHere are the parameters you can change ( for make, but some are also in cmake ):
- EMSCRIPTEN - only useful if you are building for webassm ( path to emscripten )
- PLATFORM - LINUX | WINDOWS | WEB ( Default LINUX )
- CONFIG - RELEASE | DEBUG (Default RELEASE )
- GUI - IMGUI | RAYLIB | HEADLESS ( Default IMGUI )
- TYPE - EXE | LIB - ( To create executable or library. Currently only web version can be a library. ) ( Default EXE )
I think that more or less all the examples listed on ttyplot examples should work with brplot ( just replace ttyplot with brplot. ) But here are some more examples:
brplot
1 1 2 3 5 8 13 21# Plot numbers from 1 to 69
seq 69 | brplot;# Plot squeres of numbers from 1 to 69
python -c "[print(x*x) for x in range(69)]" | brplot;nc -ulkp 42069 | brplot;nc -lkp 42069 | brplot;# This will most likely crash
cat /dev/random | brplot;#Plot temeratur of core 0 on your cpu.
# Step 0: Get sensors value
sensors;
# output:
#...
#Package id 0: +52.0°C (high = +105.0°C, crit = +105.0°C)
#Core 0: +52.0°C (high = +105.0°C, crit = +105.0°C)
#Core 1: +52.0°C (high = +105.0°C, crit = +105.0°C)
#...
# Step 1: Grep Core 0:
sensors | grep 'Core 0';
#output:
#Core 0: +52.0°C (high = +105.0°C, crit = +105.0°C)
# Step 2: Get only temperature:
sensors | grep 'Core 0' | awk -p '{print $3}';
# output:
# +52.0°C
# Step 3: Create a loop and pipe the value of core temperature to brplot every 0.1 sec.
while :; do echo $(sensors | grep 'Core 0' | awk -p '{print $3}'); sleep 0.1; done | brplot
# brplot should not care about nonnumeric symbols So input `+52.0°C` should be fine.while :; do echo $(sensors | grep 'Core' | awk -p '{print substr($3, 1, 4) ";" $2}'); sleep 0.1; done | brplot
# substr is needed because "+52.0C;1" would be recogined as:
# Add 52 to group 0
# Add 1 to group 1
# substr transforms "+52.0C" to "52.0", so one awk will output lines like "52.0;0"while :; do echo $(free | grep Mem | awk -p '{print $3/1024}'); sleep 0.01; done | brplot- Write an UDP client in python:
import socket

client_socket = socket.socket(socket.AF_INET, socket.SOCK_DGRAM)
y_value = 69 # This can be any float32 value
group_id = 420 # This can be any int32 value
port_number = 42069 # This is a port number and it MUST be 42069
client_socket.sendto(f"{y_value};{group_id}".encode(), ("localhost", port_number))
Start brplot that listens to UDP port 42069:
nc -ulkp 42069 | brplot;[[x-value],]y-value[;[line-index]]
--command value
- 10 - insert point (new_x, 10) to line group 0
- 10,12 - insert point (10, 12) to line group 0
- 10;1 - insert point (new_x, 10) to line group 1
- 10,12;2 - insert point (10, 12) to line group 2
--zoom value- zoom x & y axis to value--zoomx value- zoom x axis to value--zoomy value- zoom y axis to value--offsetx value- offset x axis to value--offsety value- offset y axis to value--show value- show value-th group--hide value- hide value-th group--extract group "Extract-str"- Define custom extraction rules
This is a string used to define how to transform input to get the data out.
Example Extract strings are:
| extractor string | input string | out-x | out-y |
|---|---|---|---|
abc%x |
abc12 |
12.f | NULL |
abc%x |
abc-12 |
-12.f | NULL |
a%xbc |
a12.2bc |
12.2f | NULL |
*%xabc |
-------12e12abc |
-12e12f | NULL |
*-%xabc |
-12e12abc |
12e12f | NULL |
*\\\\%xabc |
-------\\---\\\\12abc |
12.f | NULL |
*\\%a%xabc |
---abs\\%a12e12---\\%a10e10abc |
10e10f | NULL |
%y*aa%x |
12a14aaaa13 |
13.f | 12.f |
%y.%x |
12.13.14.15 |
14.15f | 12.13f |
Some more examples of valid and invalid extractors:
| is valid | extractor | desc |
|---|---|---|
| true | "abc%x" | |
| true | "a%xbc\\" | |
| true | "*%xabc" | |
| true | "*\%a%xabc" | |
| true | "*\\%xabc" | |
| true | "%y*%x" | |
| false | "abc%a%x" | %a is not a valid capture |
| false | "abc%" | % is unfinised capture |
| false | "abc\" | \ is unfinished escape |
| false | "a**bc" | wild can't follow wild |
| false | "a%xbc*" | wild can't be last character |
| false | "*\%xabc" | Nothing is captured. %x is escaped |
| false | "%y%x" | Capture can't follow capture Ex. : "1234" can be x=1,y=234, x=12,y=34, ... |
| false | "%y*%y" | Can't have multiple captures in the expression |
| false | "%x*%x" | Can't have multiple captures in the expression |
In the future they migh chage/be deleted.
- Right mouse button + Move mouse - Change offset
- Mouse wheel - Change zoom
- X + Mouse Wheel - Change zoom only in X axis
- Y + Mouse Wheel - Change zoom only in Y axis
- [X|Y] + [LSHIFT|LCRTL] - Change zoom [in|out] only in [X|Y] axis
- F - Follow the visible lines. ( Camera will focus on the average of newest points added to each visible line. )
- [K|J] - Change recoil for follow functionality ( quite fun if >1.f )
- T - Add test points
- C + LSHIFT - Clear all points
- C - Empty all points
- R - Reset camera offset and zoom to (0, 0) and (1, 1)
- R + LSHIFT - Reset camera zoom to (1, 1)
- R + LCTRL - Reset camera offest to (0, 0)
- D - Toggle debug view.
- S - Grab a screenshot.
- H - Hide all lines.
- H + LSHIFT - Toggle visiblity of all lines.
- 3 - Switch to 3D plot.
- 2 - Switch to 2D plot.
- C + LSHIFT - Clear all points in line which the mouse is over.
- C - Empty all points over which the mouse is over.
- Left mouse button - Toggle visiblity of the line over which the mouse is over
When built, brplot is only one file and you can install it using install command.
Here I'm installing it to /usr/bin directory, but this can be any other directory...
sudo install bin/brplot_imgui_linux_release /usr/bin/brplotmake cleansudo rm /usr/bin/brplot- ~~Make drawing lines use buffers ( Don't use DrawLineStrip function by raylib. ) Maybe use DrawMesh? It's ok for plots with ~1'000'000 points, but I want more!~~
- Implemented this now. For every line, 2 triangles are created. Old points are put in buffers and are drawn like that. Plotter can now handle 30'000'000 points, easy.
- When having many points ( 30'000'000 ), a few probles ocure:
- Distant points start being rounded up/down to the closest float. It doesn't look right.
When zoomed out a lot. It becomes quite slow. ( I guess there is a lot of drawing of the same pixel.. )- Maybe combine few lines that are close when zoomed out... ( how to detect this ? )
- This is partly fixed for plots where x values are sorted.
Problem still remains if x values aren't sorted.- This is now solved by finding intervals in which numbers are sorted one way or the other.
- But still there is a worst case when every line is in different interval, and it will cause it to once aging be slow.
- Maybe use geometry shader ( don't generate triangles on cpu. )
Gpu memory usage will be lower. Current gpu memory usage:(N lines)(2 triangles per line)(3vertices per triangle)((3 floats for position) + (3 float for tangents))*(4 bytes per float)- ~~If N = 64'000'000, gpu usage will be ~9GB. This seems high...~~
- This is partly fixed. If plot values are sequential gpu memory usage can be constant with regard to number of points.
Problem still remains if x values aren't sorted.This is now solved by using quad tree structure for storing data points.Still there is work to be done to make quad tree structure closer to optimal.- This is now solved by finding intervals in which numbers are sorted one way or the other.
I'm not happy with the thickness of the line when zooming in and out.It's not that bad, but it's inconsistent.- Made is consistent. And now it's smooth af.
Quad tree rectangles are not inside one another, bounds of the outer quad are smaller than those of the inner quad. Fix this...- I deleted everything that had anything to do with quad trees so this is not a problem anymore.
Text looks like shit... I don't know how to fix it...- Text doesn't look like shit any more. I found a way to fix it.
Values on x,y axis should be on each horizontal and vertical line. ( Not in corners. )- Did this and it looks awesome.
- Colors should be configurable. Black background is the best background, but maybe there will be a need for a white background.
- This will require having a configuration file ( Maybe )
- Or parse tty codes for changing colors... hmmm ( could be cool )
- Does ttyplot do this ??
- Add something to plot points. ( scatter plot )
- This will most likely require the use of quad tree, once again..
- Add something for testing the UI.
- I want to record my actions and that play that back to see if something will segfault...
- This will require, I guess some kind of rework of input handling.
- A structure will have to be introduced that stores two function pointers. One predicate and one action. Each frame call that predicate and if true call action.
- I saw pull request on raylib for something like that. But Ray answered that he has to look at the API more closely.
Maybe create something that does not depend on glfw and can be tested on headless servers. This would enable me to run those tests on github ci.- Implemented this. On its own, this feature is useful, already found 1 double free.
- This is more or less now fuzz testing. I like it.
- Nicer UI for setting color of a line, if it's show, maybe to export data to file or stdout.
- Started to work with imgui
- First iteration of this is done
Stack panel improvements- make it more general. So that it accepts any kind of element, not just button
- add like a scroll bar on the left size of a stack
- Fuck this shit. I moved to use imgui for this sort of stuff...
Zig build doesn't build tools/font_export.c... Make zig build that also, else default_font.h can't be created.- This is not needed anymore, because I no longer use zig. Zig is not ready yet.
Export image with numbers.- This now works more or less. Still needs a better UI and ability to change image resoultion. For now it's hardcoded
- Make screenshots work on Web
- Something to change screenshot resolution.
- Something to change screenshot name. ( Or at least directory, and then set a name to a timestamp or something... )
Fix negative zeroZoom in on the location where the mouse is located, not on center of the screen.- Fix with the help of my favorite brother Andrija.
- Export of data to a text file.
Export to format readable by brplot.Export to csv.- This will require some sort of file explorer to be implemented.
Export the whole graph ( That includes current offset and current zoom )This will require setting current offest and zoom from stdin ( Extend input format to handle this. )Maybe something like--zoomx 69.0- Did this.
- This is done.
Export what plots are visible and invisible.- Need some file explorer.
- Support for touch input.
- Support for draging with one finger.
- Support for multitouch zoom.
There is something wrong with new tokenizer. Fix this!!Support for exporting csv|brplot file by issuing command from stdin.New bug, bad numbers on x,y axis when exporting
For Imgui make a default layout- This is only applyed to web version. ( Desktop versions have ability to save stuff on disk. )
- For Imgui try to make the same shit with fonts as for raylib. Export only the subset of ttf font.
- For Imgui disable default font and use the font that is used in the rest of the graph.
Number of draw call for RAYLIB,WEB is not corret - Fix this.- Fixed
- Add ability to lineary modify a line on the graph
- Should this be done in shader
- this will then requre to not batch different lines together...
- or maybe somehow add this information to the color buffer?
- Should be this be done during resampling
- This will then require to offset points before resampling
- This is most likely the way to go...
- Offset for x-y value
- Scale for x-y value
- Should this be done in shader
Give lines a names.- Show the name of the line if you hover over it.
- Something like status bar stuff.
- Abitlity to make plots out of existing plots.
- Afine transofrm
- Plot3 = (Plot1.x, Plot2.y)
- If Plot1 = [(0, 1), (1, 2), (2, 3)] and Plot2 = [(2, 2), (3, 4), (5, 9)] then Plot3 should be [(0, 2), (1, 4), (2, 9)]
- Plot2 = Plot1.x * 2
- If Plot1 = [(0, 1), (1, 2), (2, 3)] and Plot2 = [(0, 1), (2, 2), (4, 3)]
- ...
- This should not require allocation of new memory for each point
- Could be evalueted lazily
- Plot3 = (Plot1.x, Plot2.y)
- Non afine transforms
- Plot2 = (sin(Plot1.x), cos(Plot1.y))
- This should require allocation of new memory
- This will require some sort of mechanism for calculating resulting points every frame such that high fps is not compromised. Say every frame calcuate 1'000'000 points.
- Afine transofrm
- Ability to generate plots out of expressions
- Say Plot1(x) = sin(x)
- Small regex stuf to definine how to get points from file.
Something like--extract 2 "F*oo%xB*ar%y"- If input line is "Foasdasdo10Baasdasdar18" Then caputred point should be (10, 18)- Maybe add multipe points per line "Foo%1x %2y %2x %1y": "Foo10 11 12 13" -> [(10, 13), (12, 11)]
- Current implementation is recursive, maybe think of a way to make it non recursive.
- Current implementation runs each extractor one by one. Think of a way to run then in lock step.
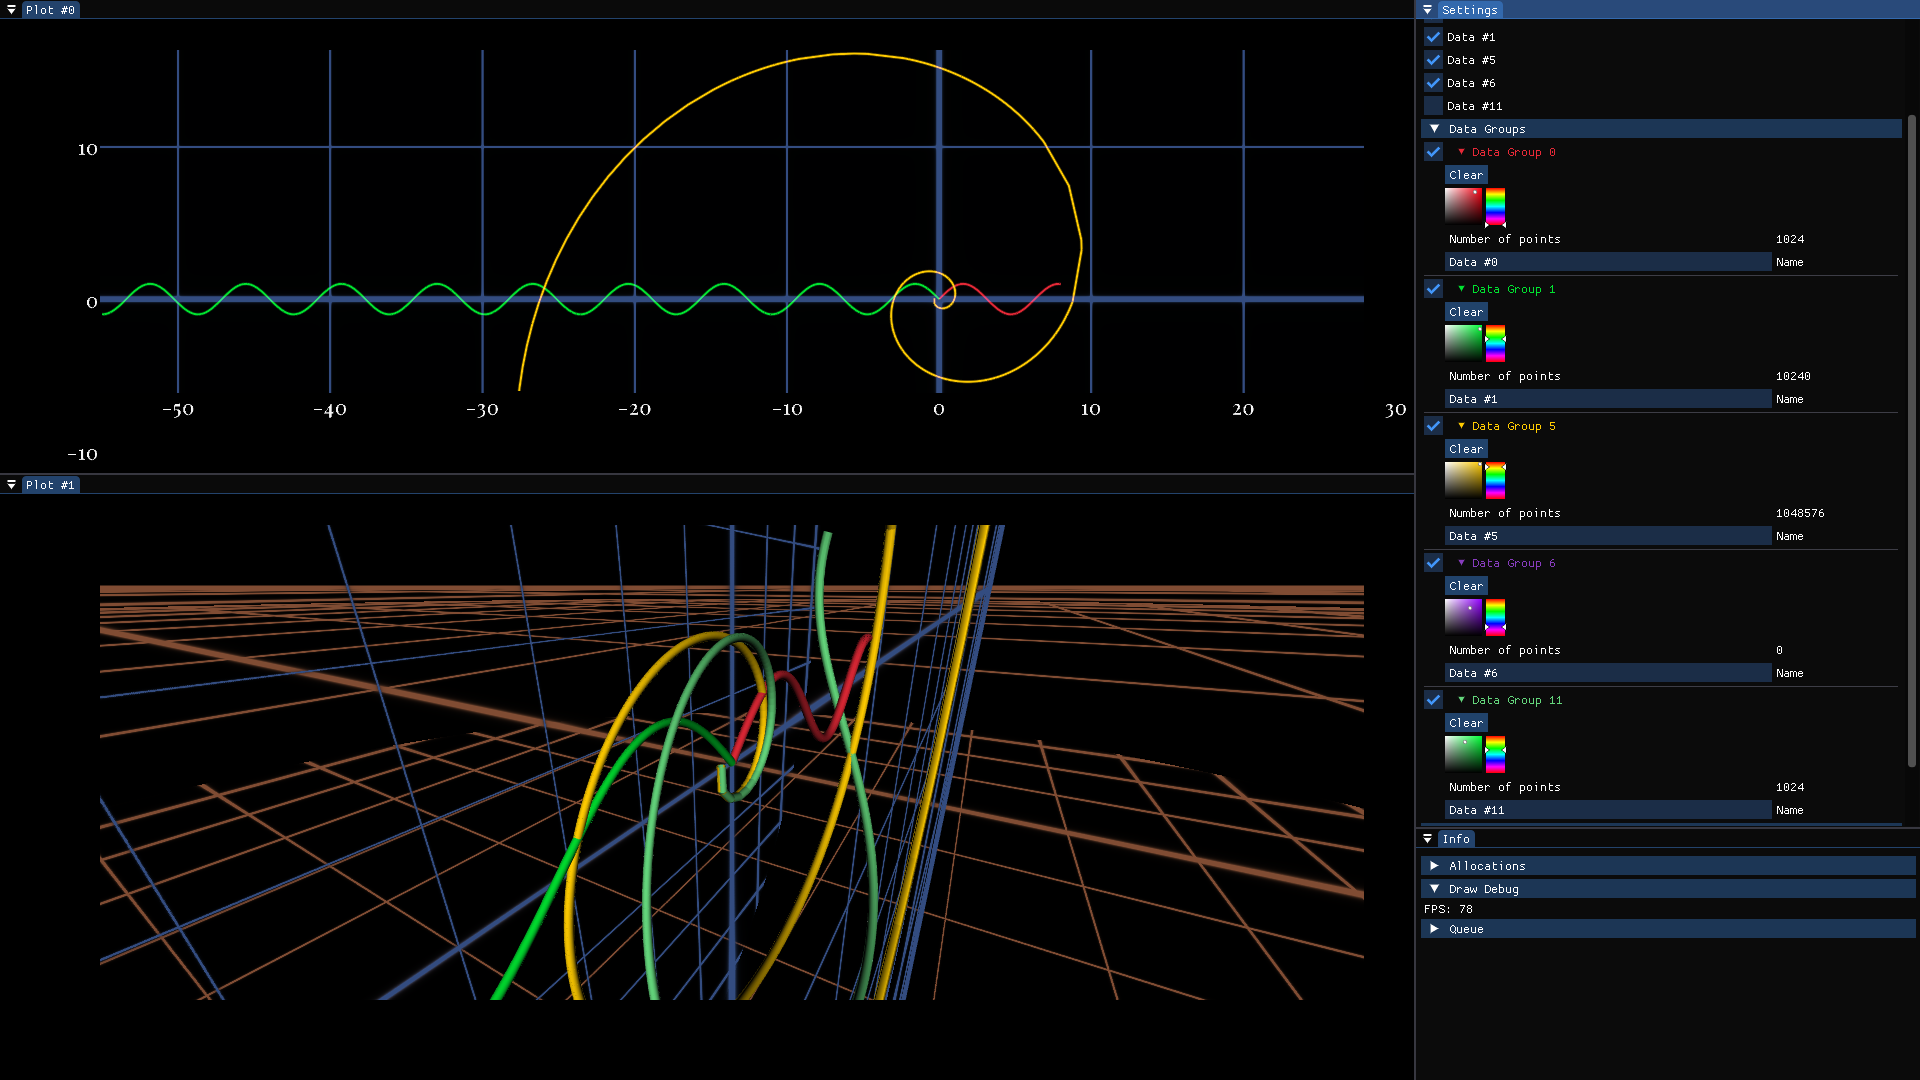
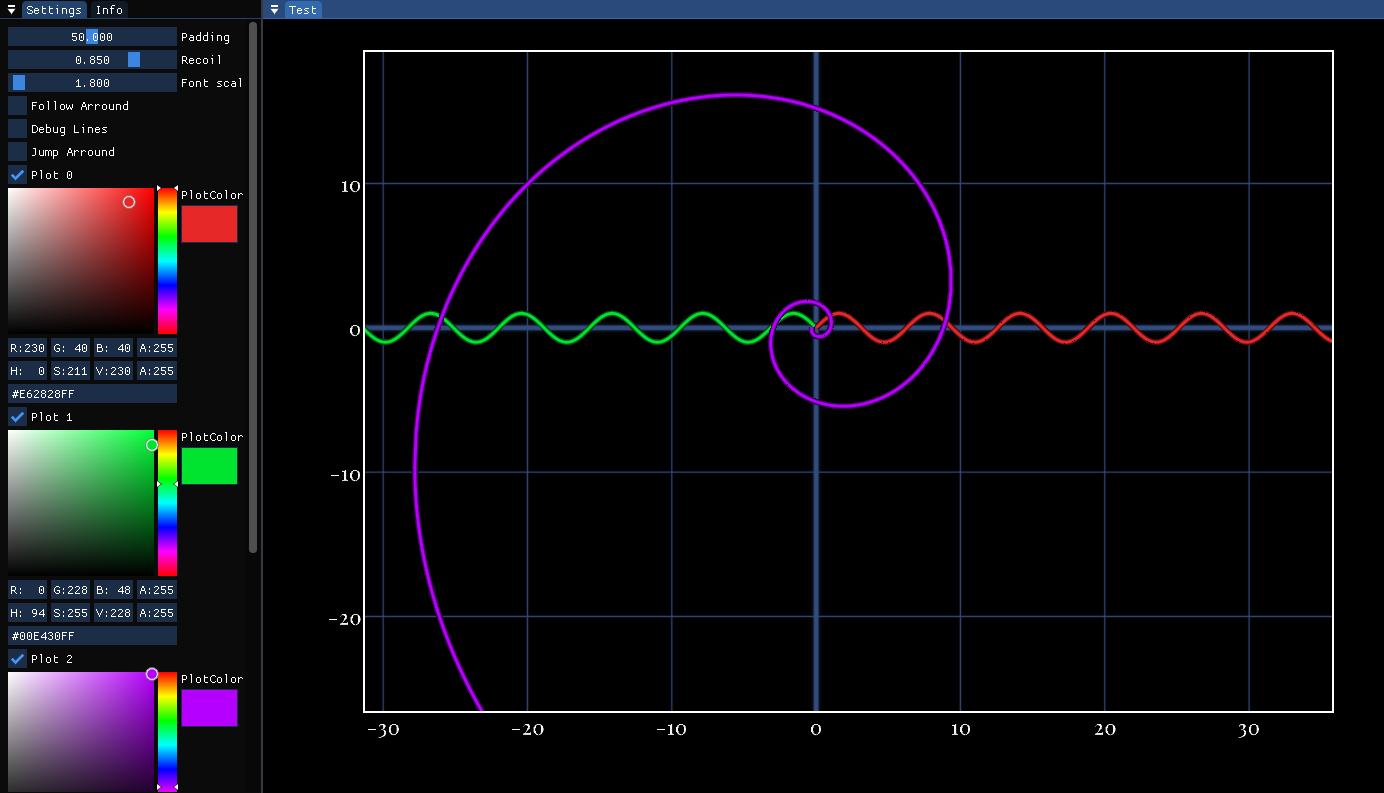
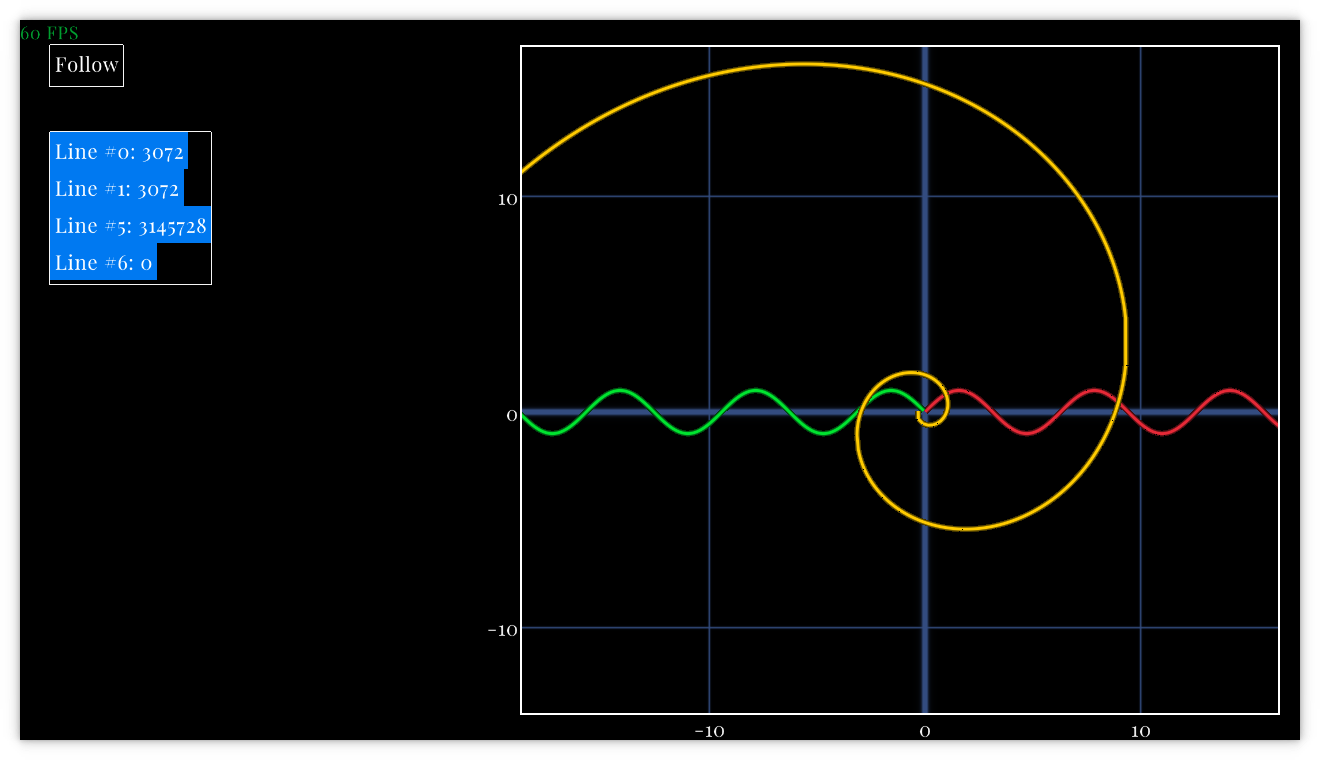
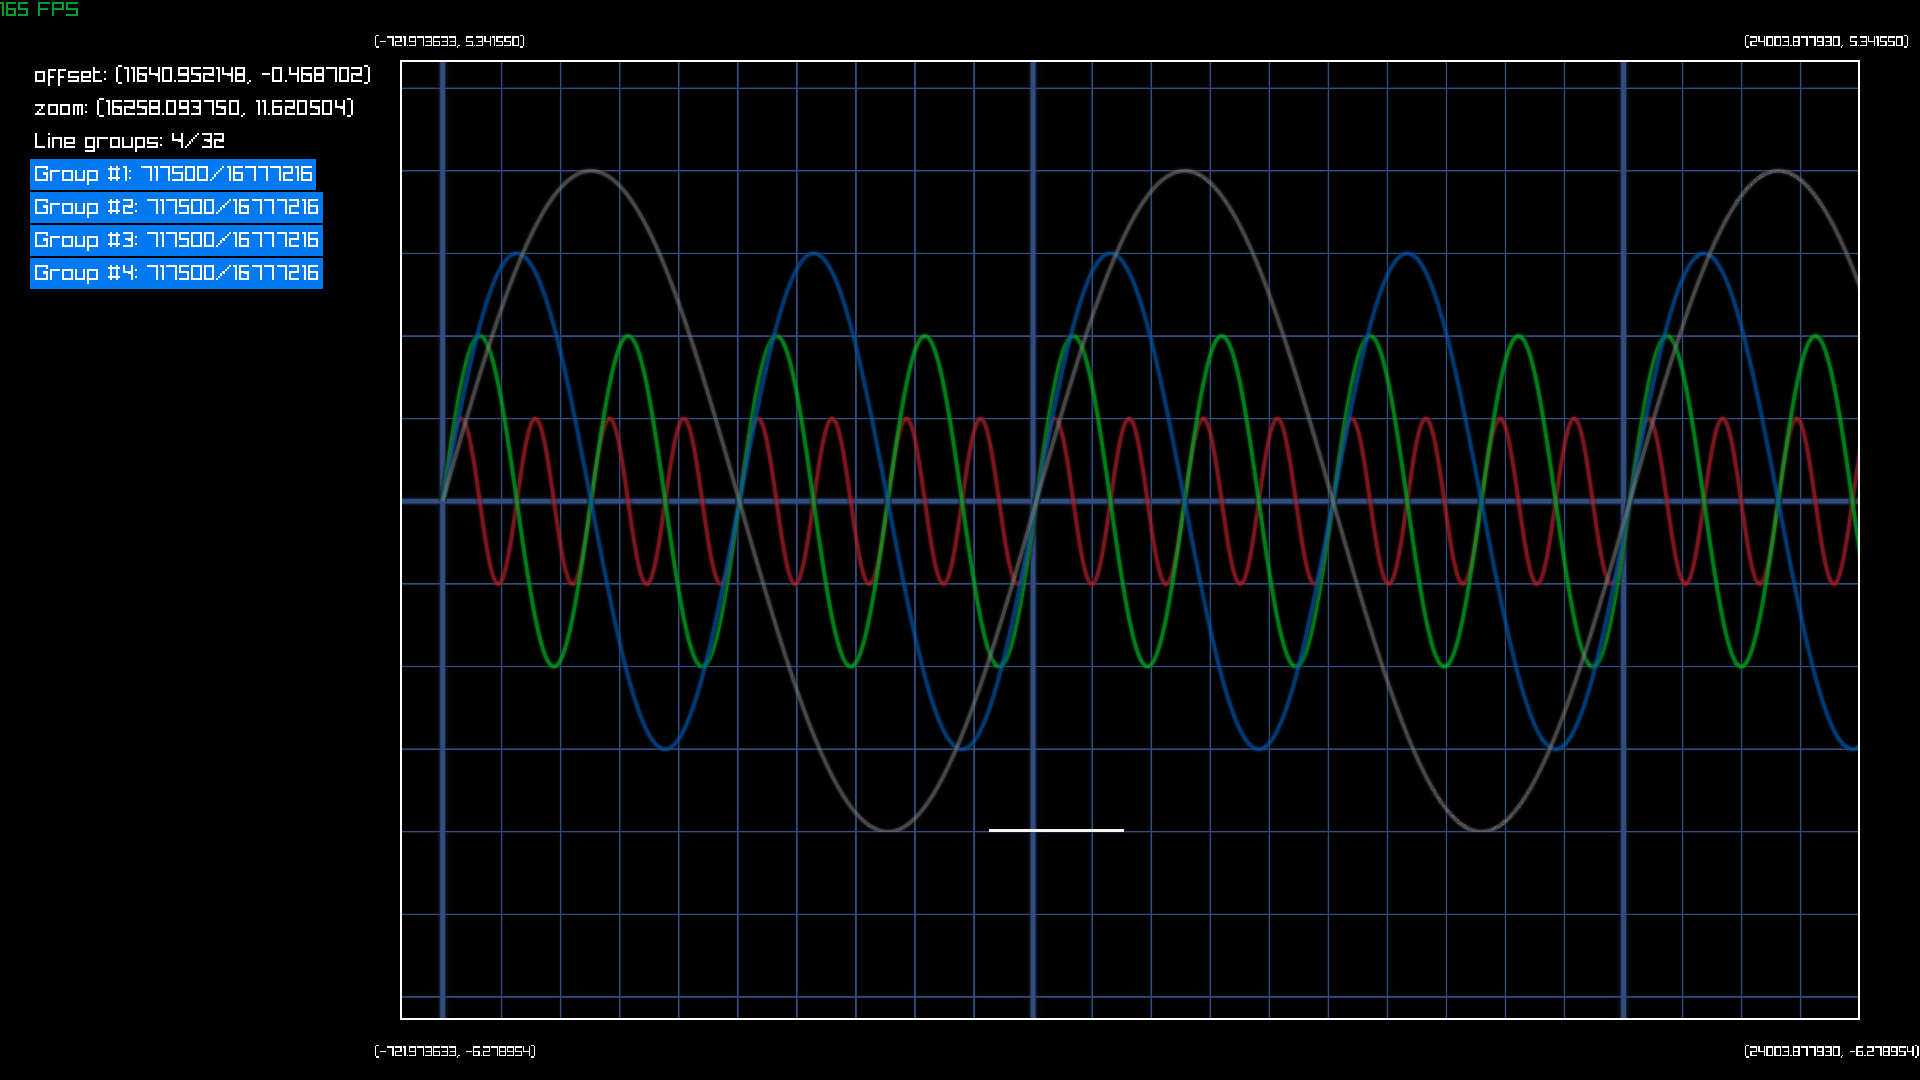
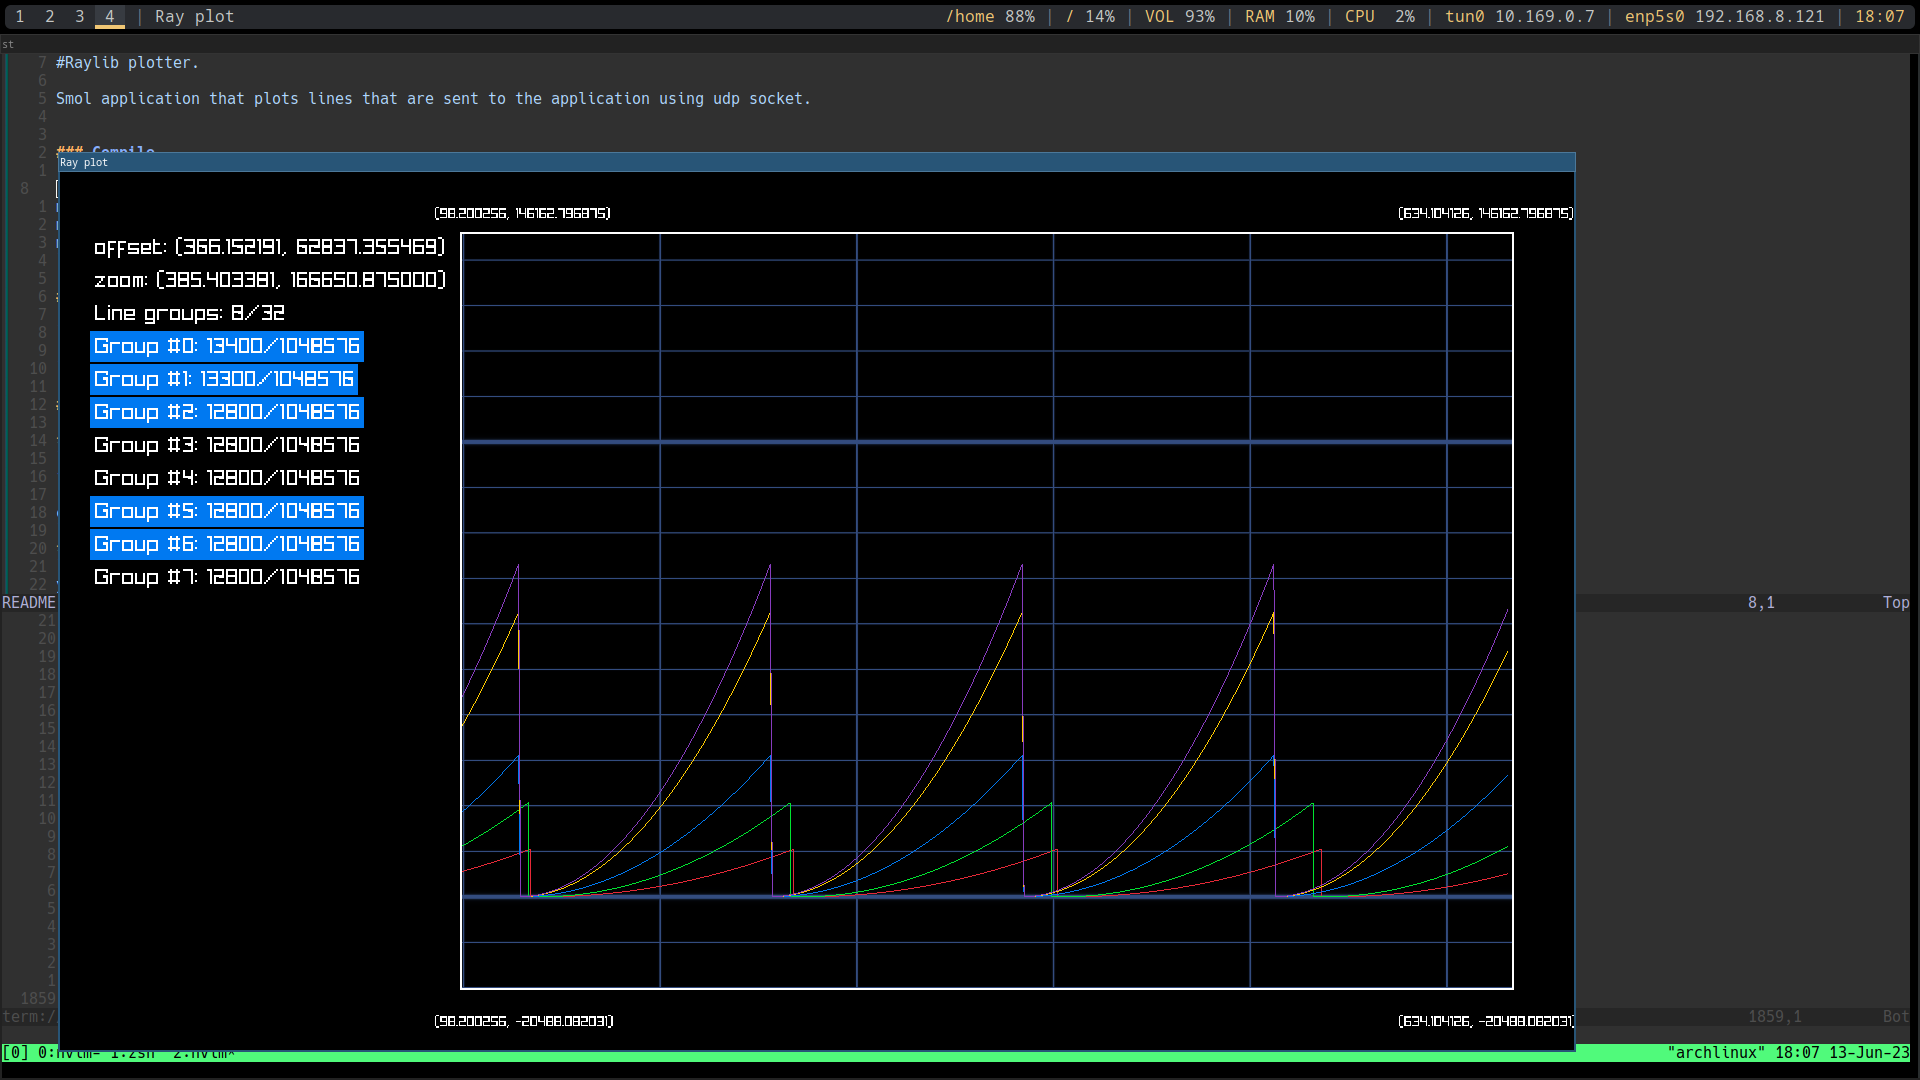
Here is a history of how brplot looked over time:
MIT
