See it here: algorithms-tour.stitchfix.com
Made by: Eric Colson, Brian Coffey, Tarek Rached and Liz Cruz
Made with: Mike Bostock's D3.js and Jim Vallandingham's scrollytelling code
Inspired by: Stephanie Yee and Tony Chu's Visual Introduction to Machine Learning, Victor Powell and Lewis Lehe's Explained Visually project, and Ilya Katsov's post on Data Mining Problems in Retail
This project was an iterative creative endeavour; we've cleaned up the code a bit, but acknowledge that it is not the prettiest thing you'll ever see. Apologies in advance for any pain caused. That said, we hope you find some bits of it useful or interesting.
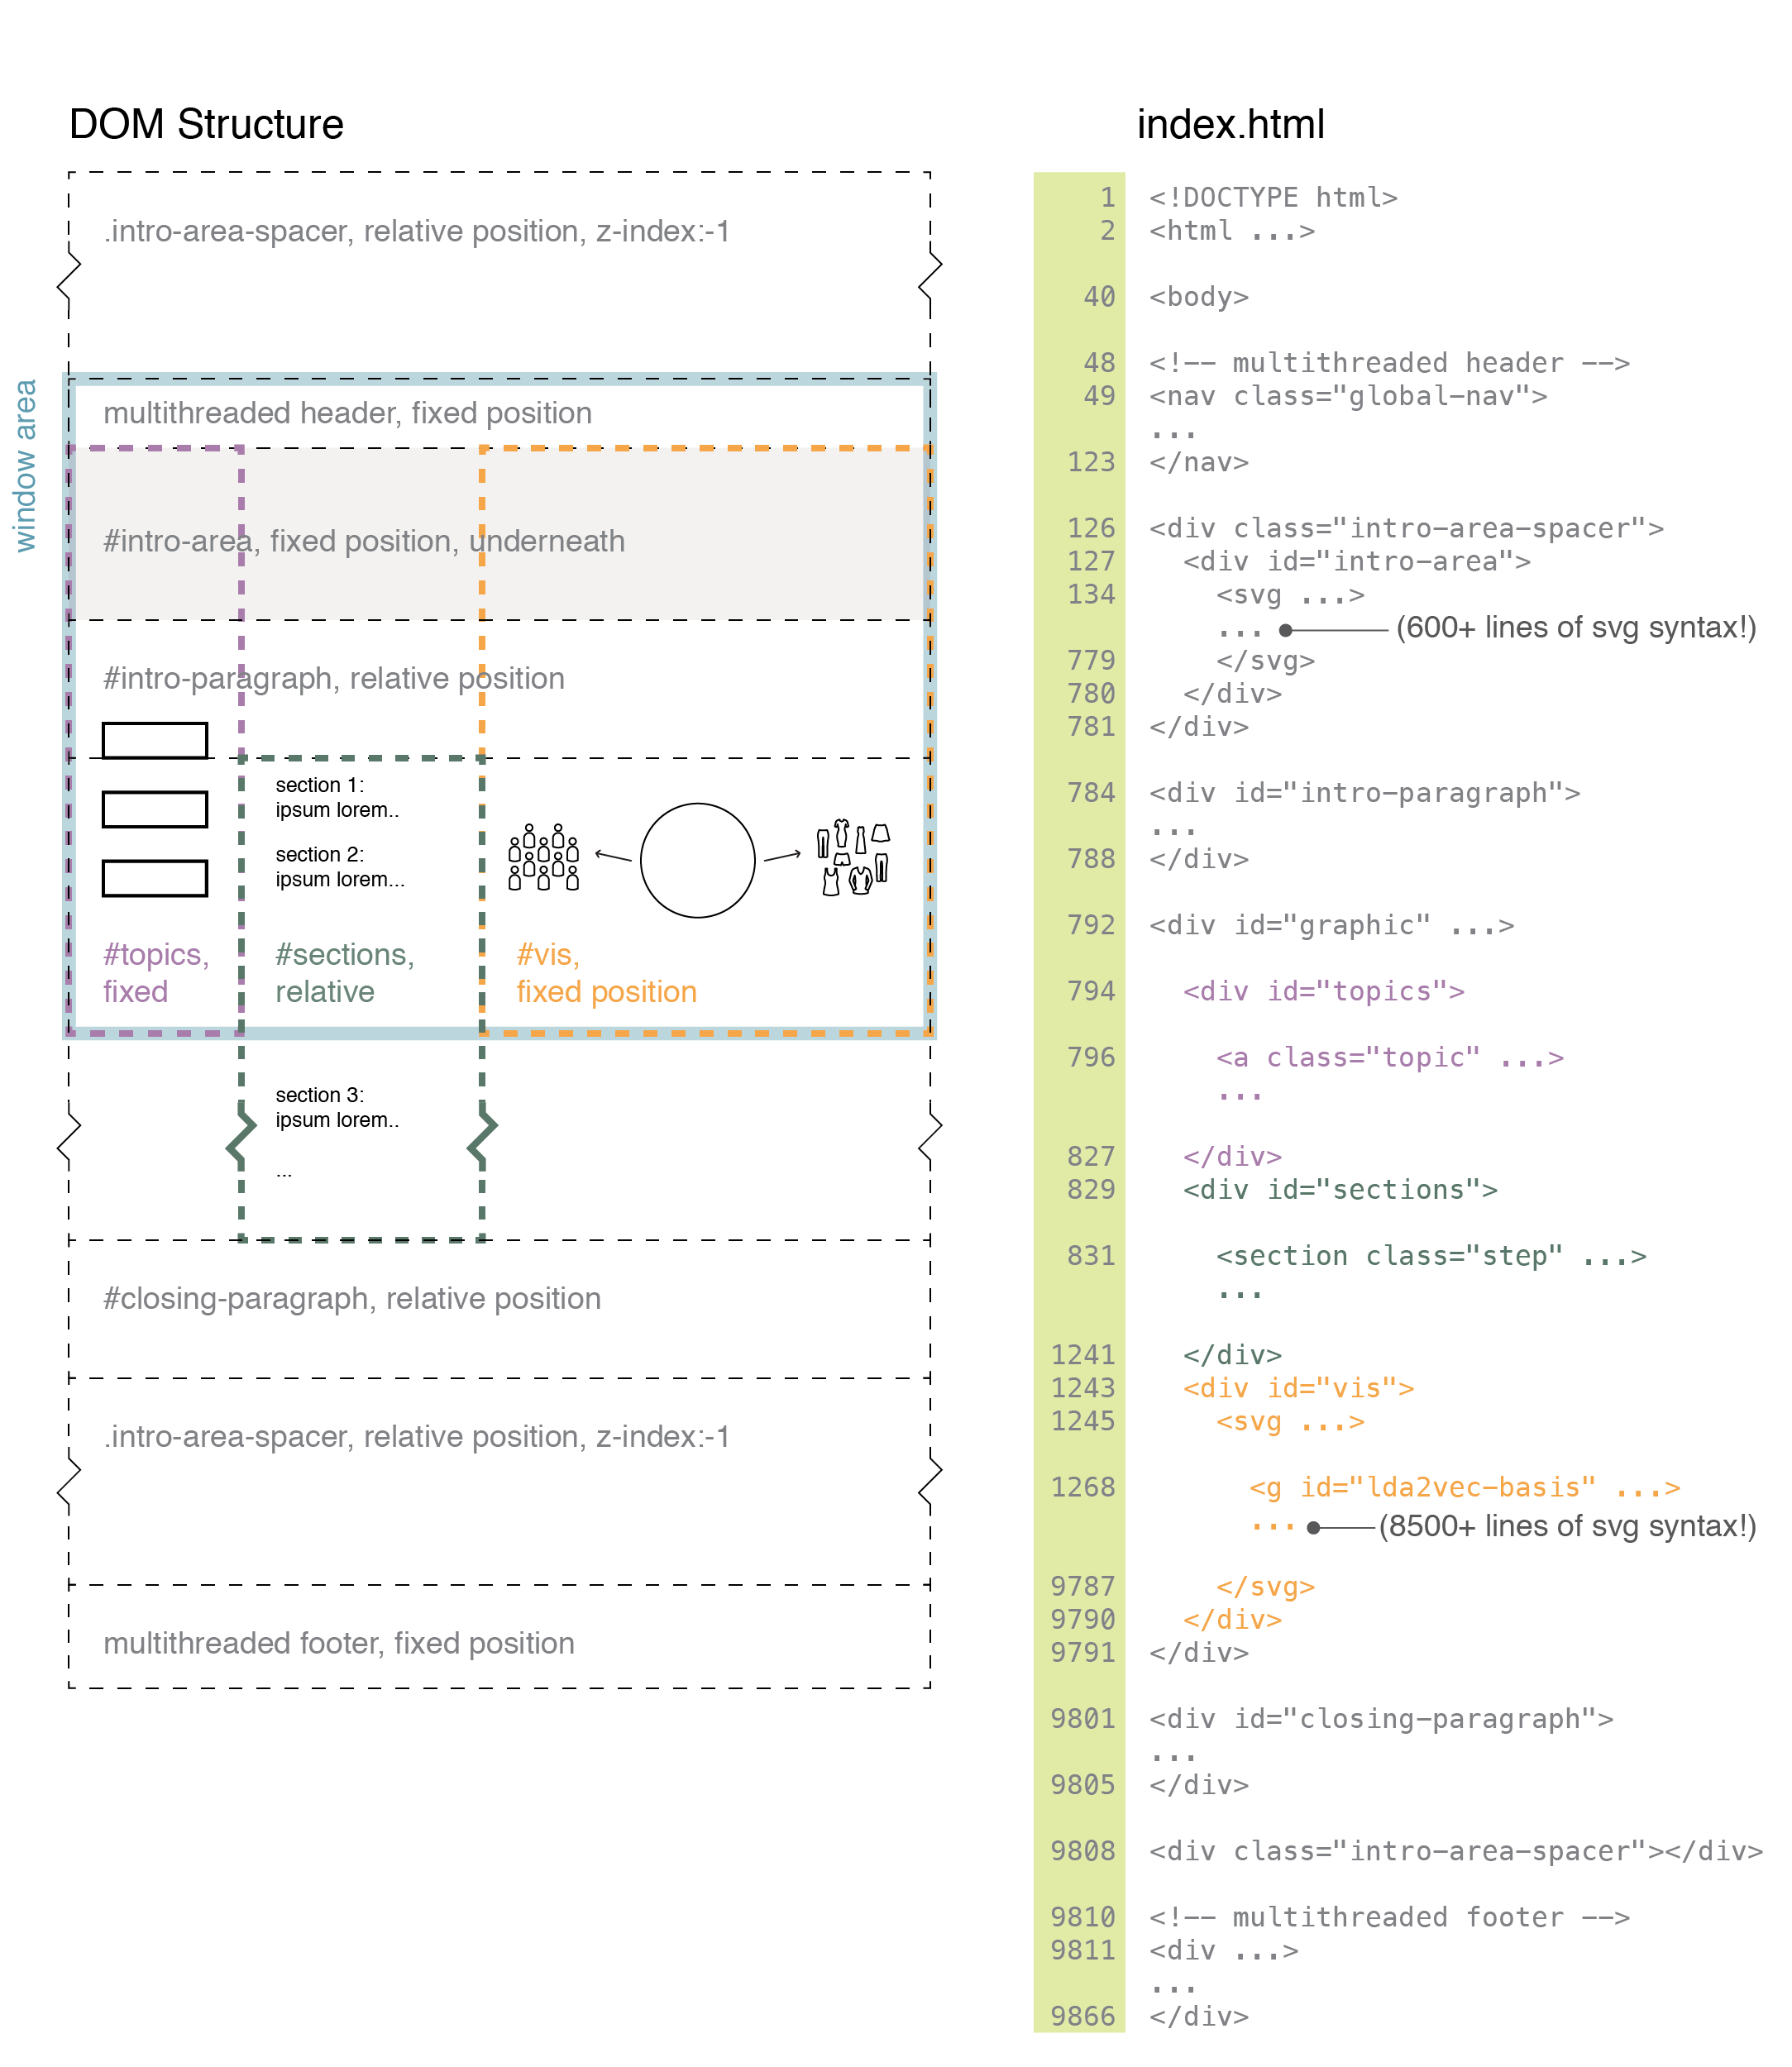
The figure below illustrates the overall structure. The two most important <div> elements are the #sections and #vis elements, which play the roles described in Jim Vallandingham's description: the #sections div contains a set of <section class="step"> elements that form the text column on the left, and whose positions determine which javascript functions are called when to manipulate the visual elements in the #vis div. To these two we've added a #topics div at the far left for "story" buttons / progress indication. These three <div>s are wrapped in a #graphic <div> (not shown below to avoid clutter), in keeping with Vallandingham's structure.
If you take a quick gander at the index.html file, you will see a lot of svg syntax. There are two <svg> elements in the file: the first one you encounter is the less important one which is only used for the introduction animation (it is a full-screen svg within the #intro-area div); the second one is the main <svg> and is within the #vis div.
The drawing elements within these <svg>s constitute almost all of the static elements within the animation (i.e. those which are only made to appear for a particular section or set of sections and then disappear again, and which are not otherwise animated) and starting points for many of the elements that are actively animated. (Some other DOM elements are added via javascript, usually those which are simpler, in multiples and actively animated.)
These svg elements were drawn primarily in Adobe Illustrator (though any such graphical program could be used so long as it supports svg saving or export) and then simply pasted into the index.html file: this certainly bloats the file and is ugly to see in an html file, but it does make for a handy iterative workflow.
The first hierarchical level within the <svg> is composed entirely of <g> elements, each with an id that corresponds to the layer name in Illustrator and which gets referenced by the javascript functions that control the animation (e.g. by turning their display property on or off for different parts of the animation). Among these id'd high-level <g> elements, there are also some empty ones, which are used as stages for js-constructed elements as the animation proceeds.
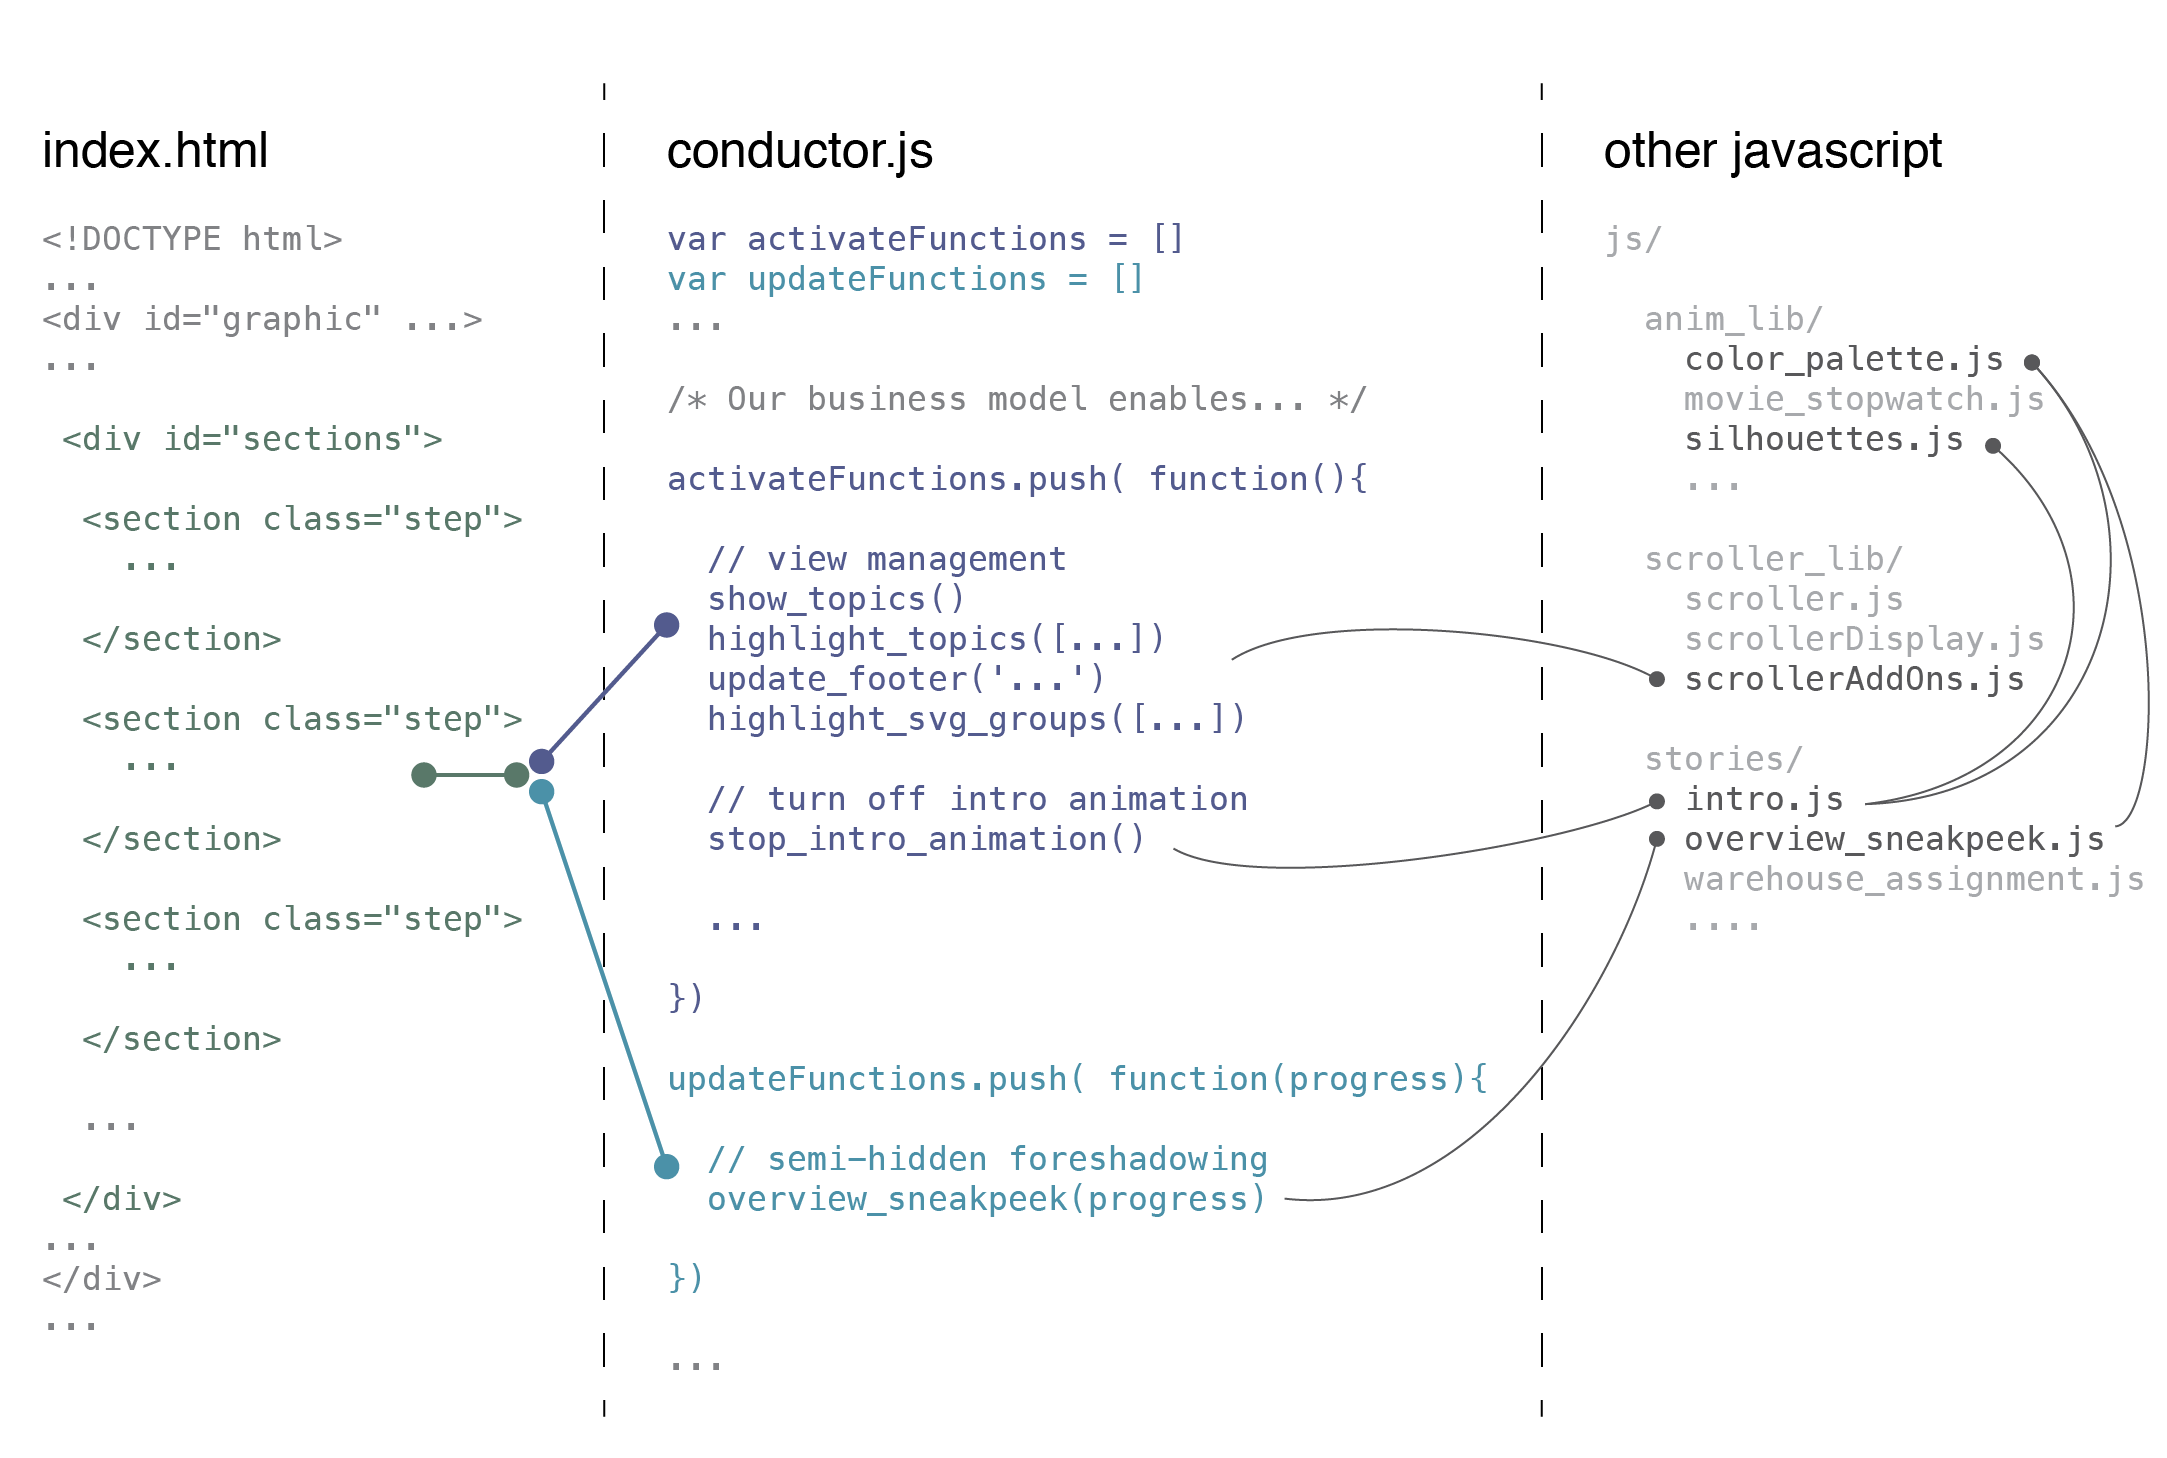
For each <section class="step"> element in #sections (contained in index.html), there are two corresponding functions in conductor.js: an "activate" function, which is called when that section is scrolled into prominence (i.e. when the section above it reaches the top of the window); and a "progress" function, which is called for any scroll action within that section, and which uses the relative position within the section as a function parameter named progress.
These "activate" and "progress" functions reference other functions found in files the js/ tree, some of which are used in almost every section (e.g. in js/scrolling-lib/scrollerAddOn.js there is a function to smoothly highlight particular svg > g elements and turn everything else off), and some of which only apply to particular "stories" (i.e. those in the js/stories/ folder). There is also a set of multiple-use functions in js/anim-lib that are referenced by various the functions of various "stories".
It is in the js/stories/ folder that you will find most of the code that looks like more typical D3 usage. If / when we get time, we'll return to some of our favorite animations therein and produce cleaner and better documented versions of them.
We hope you enjoy playing with it at least half as much as we've enjoyed making it.

