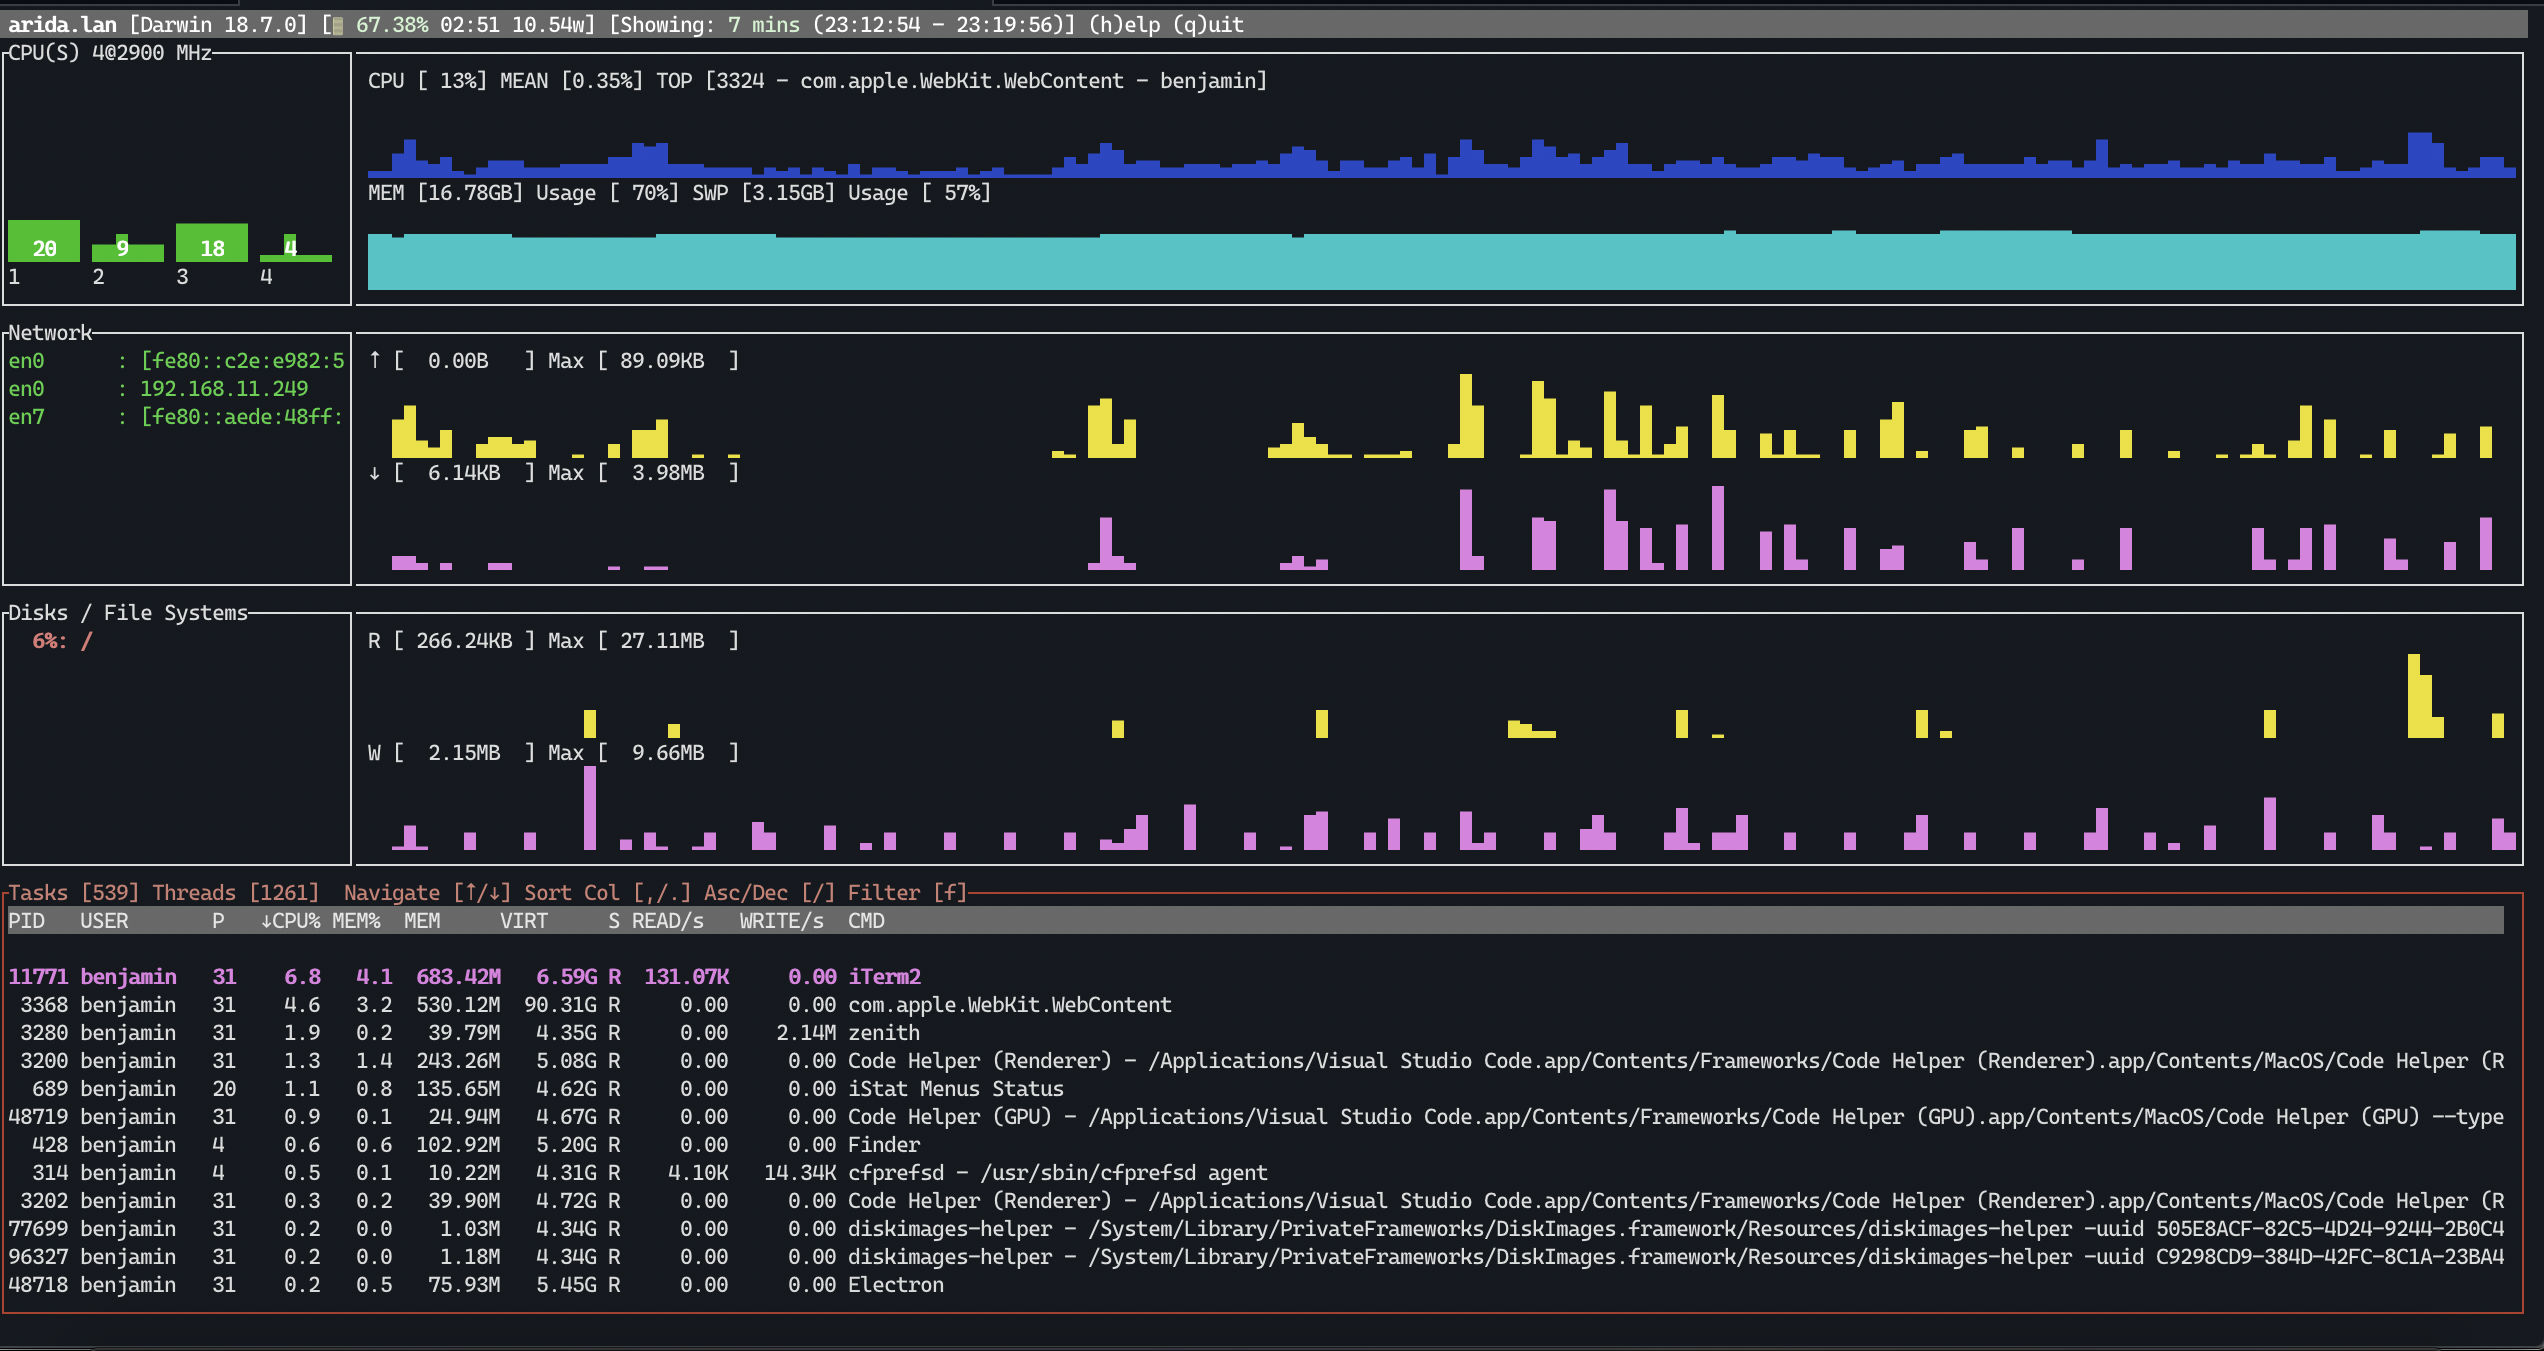
- Optional CPU, Memory, Network, and Disk usage charts
- Quick glances at Disk free space, NIC IP addresses, CPU frequency
- Highlight top users of CPU, Memory, & Disk
- Battery percentage, time to charge or discharge, power used
- A top-like filterable process table that includes per process disk usage
- Change process priority
- Zoomable chart views (with support to scroll back in time)
- Managing processes with signals
- Performance data saved between runs
- GPU Utilization Metrics for NVIDIA GPUs (with
--features nvidia)
- CPU steal percentage and general virtualization awareness
- Sensor Temperature charts
- Per process network usage (Linux)
- Messaging about adverse system events, like errors in kernel ring buffer (Linux)
- Docker support
- ZFS (pool status)
- GPU utilization metrics for AMD GPUS
- Disk metrics like IO ops / latency
- Support Memory pressure
- Linux
- MacOS
- BSD (OpenBSD/FreeBSD)
- Perhaps Redox OS.
Download one of the compiled releases.
brew install zenithThis builds under rustc version >= 1.40.0.
cd zenith
cargo build --release
For NVIDIA GPU support, build with feature nvidia:
cargo build --release --features nvidia
Running with no arguments starts zenith with the default visualizations for CPU, Disk, and Network and a refresh rate of 2000 ms (2 seconds). These can be changed with command line parameters:
    zenith [FLAGS] [OPTIONS]

FLAGS:
        --disable-history    Disables history when flag is present
    -h, --help               Prints help information
    -V, --version            Prints version information

OPTIONS:
    -c, --cpu-height <INT>        Height of CPU/Memory visualization. [default: 10]
        --db <STRING>             Database to use, if any. [default: ~/.zenith]
    -d, --disk-height <INT>       Height of Disk visualization. [default: 10]
    -n, --net-height <INT>        Height of Network visualization. [default: 10]
    -p, --process-height <INT>    Min Height of Process Table. [default: 8]
    -r, --refresh-rate <INT>      Refresh rate in milliseconds. [default: 2000]
Don't want a section? Remove it by setting the height to 0.
For example: zenith -c 0 removes the CPU chart.
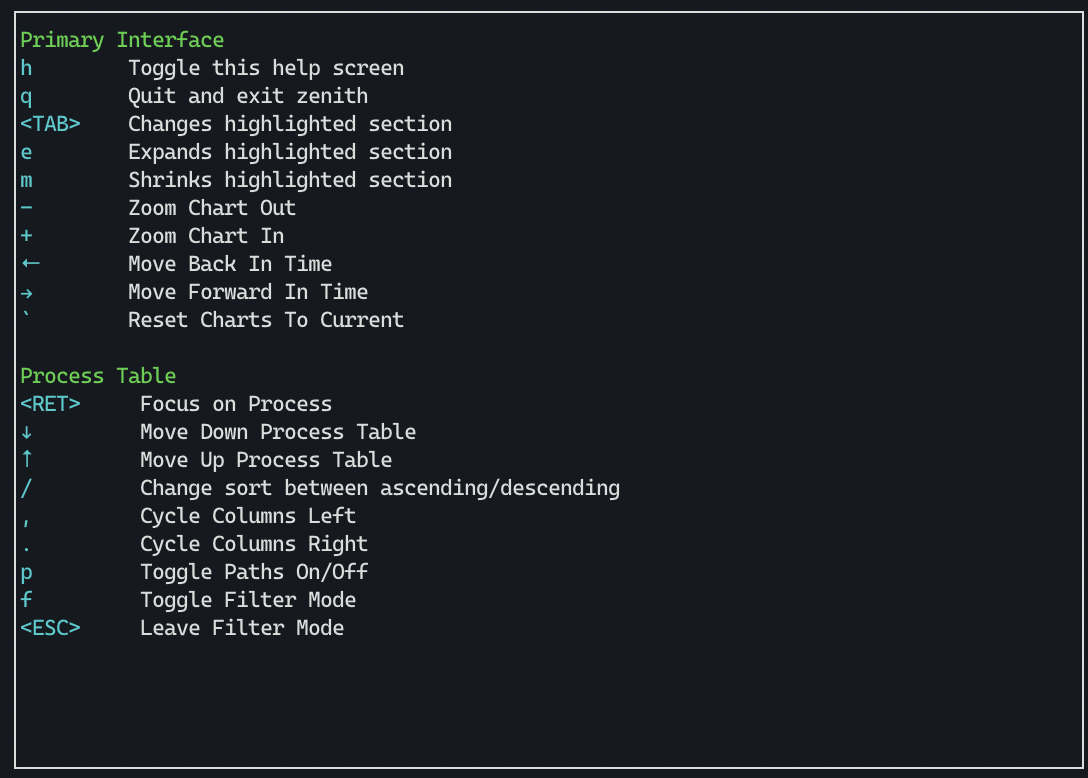
Up/down arrow keys move around the process table. Return (enter) will focus on a process. Tab switches the active section. Active sections can be expanded (e) and minimized (m). +/- (or =/-) will zoom in / out all of the charts. Arrow keys (←/→) move forward/backward in time. Back tick (`) resets the chart to current time and max zoom. Using these options you can create the layout you want.
In zenith 'h' key will show this help:

