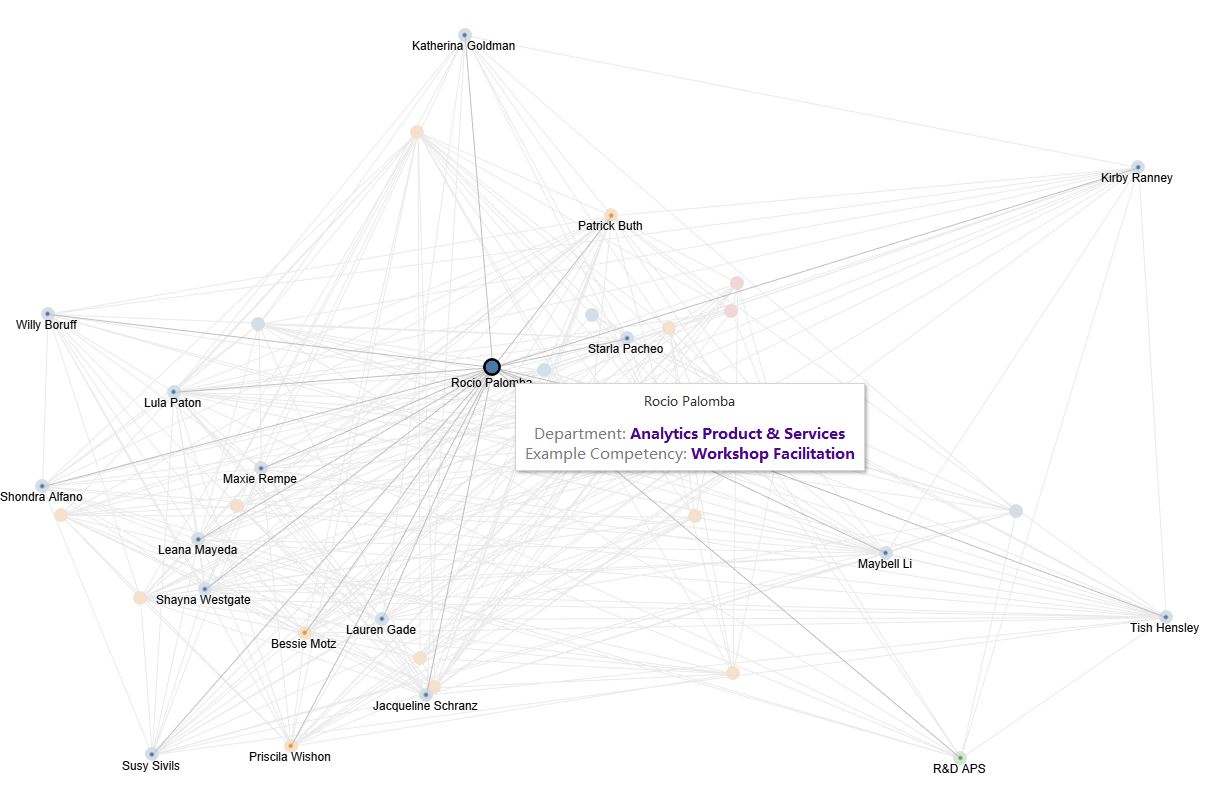
A repo containing python and Alteryx-python scripts that prepare data for network visualisations in Tableau. These scripts use the "networkx" package, documentation is available here: https://networkx.org/documentation/stable/index.html
To create the Network Charts, a certain data structure is required for Tableau. The first step is to create an input dataset that matches the following criteria:
- It must contain a column called "Target ID" which identifies the target node, and a column called "Source ID" which identifies the source node.
- It must contain a column called "Name" which links each edge with both the source node and the target node.
For example, in a network representing knowledge flows among team members, if Sophie asks Andrew for advice on Database Management, the data needs to represent that link as above, with values otherwise repeated across the rows.
With this input dataset configured, you can use the python scripts shared in this repository to create the coordinates needed to plot a network chart in Tableau. The script is available both as a Jupyter notebook and as a txt to be copied into Alteryx, to accommodate your data preparation preferences.
To interact with the "final product", view an example Tableau Network Chart here: https://public.tableau.com/app/profile/sophie.hiscock/viz/NetworkCharts1/NetworkVisualisation

