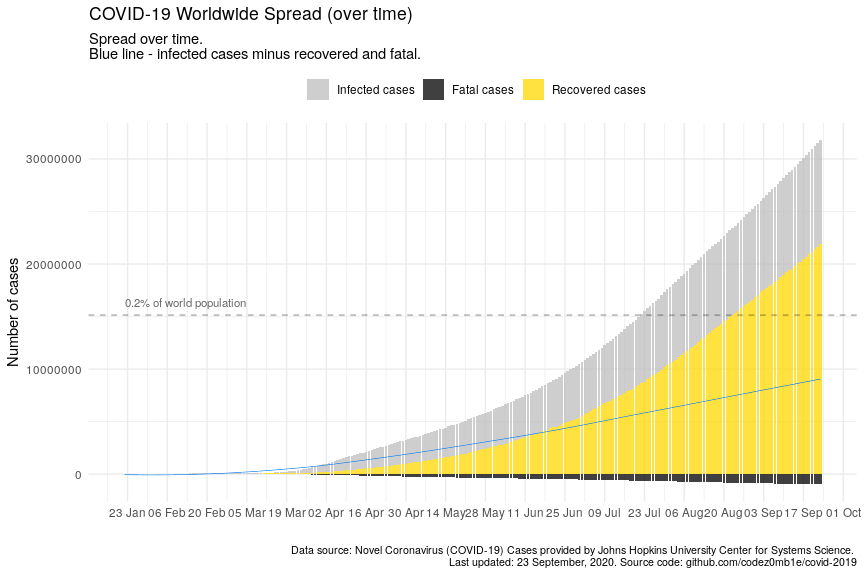
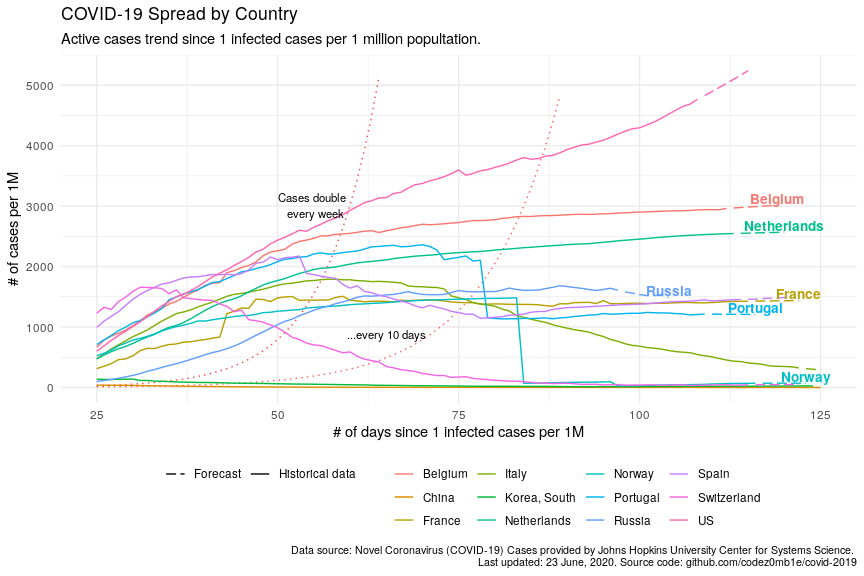
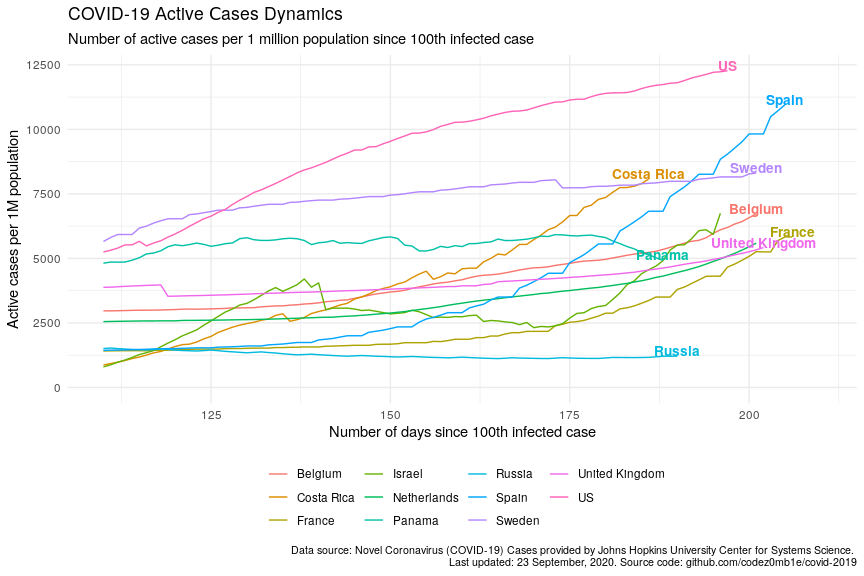
Analysing COVID-19 (2019-nCoV) disease.
Upload the latest datasets:
. ../data/download-data.sh
Kernels:
Forecasting methods:
- Previous value (naive approach)
- Indicators: simple moving average (SMA), exponential moving average (EMA), double EMA
- ARIMA, ETS
- Prophet
- Linear models: linear regression, Quasi-Poisson regression
- Decision trees: boosting
- Neural networks: LSTM, AR RNN
- SIR model
- Coronavirus disease outbreak, World Health Organization.
- Coronavirus Disease 2019, Wikipedia.
- Here’s what coronavirus does to the body, nationalgeographic.com.
- COVID-19 SARS-CoV-2 preprints from medRxiv and bioRxiv, medrxiv.
- COVID-19 Data Repository by Johns Hopkins CSSE, GitHub.
- Novel Corona Virus 2019 Dataset, Kaggle.
- Coronavirus disease (COVID-2019) situation reports, World Health Organization.
- COVID-19 Open Research Dataset (CORD-19), Kaggle.
- COVID-19 Complete Dataset (Updated every 24hrs), Kaggle.
- #covid19 tag, Kaggle.
- An interactive visualization of the exponential spread of COVID-19, 91-DIVOC.
- Tomas Pueyo. Coronavirus: Why You Must Act Now, Medium.
- COVID-19 Cases Map, Yandex.
- COVID-19 Animated Spread Map, healthmap.org.
- COVID-19 Cases Metrics, worldometers.info.
- Coronavirus tracked: the latest figures as the pandemic spreads, Financial Times.
- Understanding and tracking our progress against COVID-19, Microsoft.
- COVID-19 statistics, Yandex.
- Timeline of the 2019–20 coronavirus pandemic, Wikipedia.
- Huang C., Wang Y., et. al. Timeline of the coronavirus onset, The Lancet.
- Harry Stevens. These simulations show how to flatten the coronavirus growth curve, Washington Post.
- Kevin Simler. COVID-2019 spread simulation, Melting Asphalt.
- The COVID-19 Vulnerability Index: post, research paper, source code, ClosedLoop.ai.
- COVID19 Global Forecasting: week 1, week 2, week 3, week 4, and week 5, Kaggle.
- Computational predictions of protein structures associated with COVID-19, DeepMind.
- Sberbank COVID-19 forecast, Sberbank feat. ODS.ai.
- COVID-19 Estimates, Imperial College London.
- SIR (Susceptible-Infected-Recovered) model, covid19-scenarios.org.
- Open collaboration on COVID-19, GitHub.
On God we trust. For everything else bring Data.


