A "deep dive" into global shark attack data. Some questions we'll try to answer:
- What types of activities are most correlated with shark attacks?
- Where do most shark attacks occur?
- What species are responsible for the most attacks (fatal attacks)?
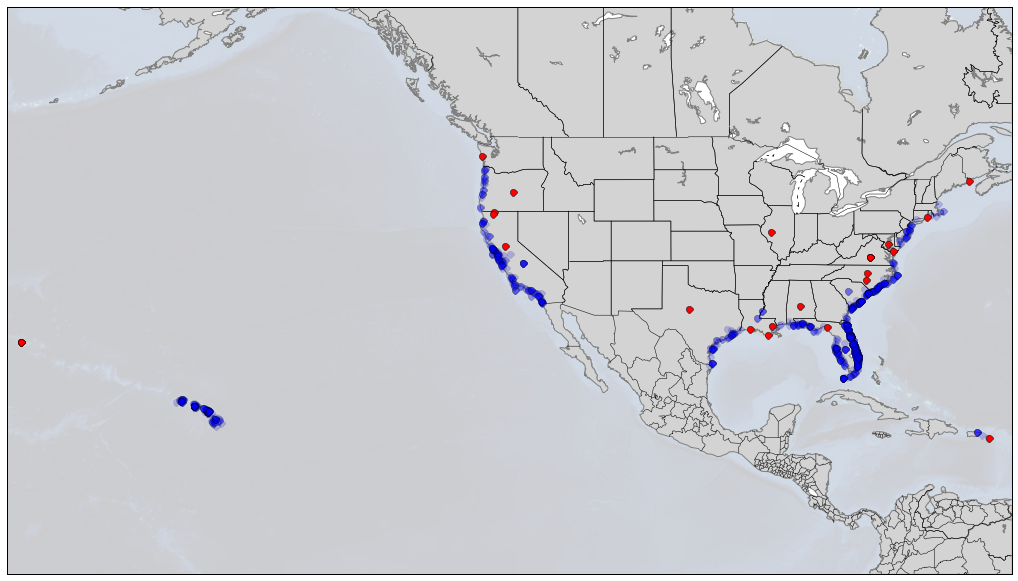
In doing this, we'll do a bit of plotting (barcharts and the like), as well as attempt to visualize the geospatial nature of shark attacks!
A preview of one of our plots (note the "Landsharks!")

Packages we'll use (also listed in our requirements.txt file):
| Package | Version |
|---|---|
| ggplot | 0.11.5 |
| matplotlib | 1.5.3 |
| numpy | 1.11.3 |
| pandas | 0.19.1 |
| geopy | 1.11.0 |
| scikit_learn | 0.18.1 |
Files include:
├── README.md
├── Rodeo_sharks_part1.py   #Part 1 of script  (plotting, activites)
├── Rodeo_sharks_part2.py   #Part 2 of script (geocoordinate plotting)
├── data
│   ├── GSAF5.xls           #File from ISAF (http://www.sharkattackfile.net/spreadsheets/GSAF5.xls)
│   └── sharks_coords.csv   #csv with longitude and latitude computed
├── imgs
│   ├── USA_sharks.png
│   ├── fatal_shark_attacks_by_activity.png
│   ├── shark_activities.png
│   ├── shark_attacks_by_activity_type.png
│   └── shark_outliers.png
└── requirements.txt