 _____ _____ _____ _____ _____ _____ __    _____ _____ _____ _____ _____ __ __
|     |  _  |   __|   | |_   _|   __|  |  |   __|     |   __|_   _| __  |  |  |
|  |  |   __|   __| | | | | | |   __|  |__|   __| | | |   __| | | |    -|_   _|
|_____|__|  |_____|_|___| |_| |_____|_____|_____|_|_|_|_____| |_| |__|__| |_|
 _____ _____ _____ __    __
|   __|  |  |   __|  |  |  |
|__   |     |   __|  |__|  |__
|_____|__|__|_____|_____|_____|Logs, metrics, and traces are often known as the three pillars of observability. We take great care to ensure we cover these pillars in our services.
But, underpinning these services is usually a script. Bash has been around for many decades now and other shells for even longer. This is usually the glue that ensures we can manage, deploy and perform many tasks around the services that we develop.
Why not ensure that these scripts are observable and send back telemetry data as well? This is the aim of opentelemetry.sh, a set of OpenTelemetry functions for shells.
The functions utilise the OpenTelemetry Protocol Specification (OTLP) to send telemtry data back to any service that supports OTLP (HTTP). This is traditionally via an OpenTelemetry Collector or a vendor that supports this API specification.
These functions have been tested on several bash versions, the list is as follows, 3.x, although looking to deprecate support for this soon (tm), 4.x an 5.x.
Other versions and shells, your mileage may vary.
Whilst all effort has been made to limit the use of external binaries from the standard bash built-in commands, this is the list of binaries required or this library:
curl: a tool for transferring data from or to a serverdate: display or set date and timehostname: set or print name of current host systemjq: Command-line JSON processoruname: Print operating system name
As a future enhancement all effort will be made to remove the need for as many external binaries as possible and just utilise the built-in functions.
Whilst the OpenTelemetry Protocol Specification (OTLP) specifications are too extensive to implement with-in a shell environment, a select few have been added, and will continue to expand as time goes on.
The following features are supported.
Yet to be implemented.
You can currently create the following metric types;
- Gauge, double and int values
- Sum, double and int values
Tracing is supported with a rudimentary, parent/child relationship. The following attributes are being associated to each span:
- Calling function, whether in main() or an outer function
- Invoked command with-in script
- Invoking line number with-in script
- Script name
- Line number
- Ability to add user specified resource attributes
The resource detectors can be used to detect resource information from the host, in a format that conforms to the OpenTelemetry resource semantic conventions, and append or override the resource value in telemetry data with this information. Currently the following detectors are supported:
- Azure Pipelines
- Bitbucket Pipelines
- Buildkite
- Circle CI
- Codefresh
- Github Actions
- Gitlab CI
- Google Cloud Build
- Harness
- Jenkins
- Jenkins X
- Travis CI
The easiest way to get started is to clone the repository and then . opentelemetry-shell/library/otel_metrics.sh or . opentelemetry-shell/library/otel_traces.sh to source the functions.
A set of examples have been created to show case the ease of use, in creating traces and custom metrics. Please have a look at the examples.
Firstly, define your library and exporter endpoint variables, before testing any of the examples, both http and https prefixes are supported:
export OTEL_EXPORTER_OTEL_ENDPOINT="http://localhost:4318"
export OTEL_SH_LIB_PATH="opentelemetry-shell/library"Simply, . source as follows . opentelemetry-shell/library/otel_metrics.sh:
#!/usr/bin/env bash

# Import functions
. opentelemetry-shell/library/otel_metrics.sh

# Main
log_info "Pushing metric ko.wal.ski/brain/memory/used_bytes..."
otel_metrics_push_gauge "ko.wal.ski/brain/memory/used_bytes" \
  "Memory usage in bytes." \
  "By" \
  "memory_type" \
  "evictable" \
  $RANDOM \
  int
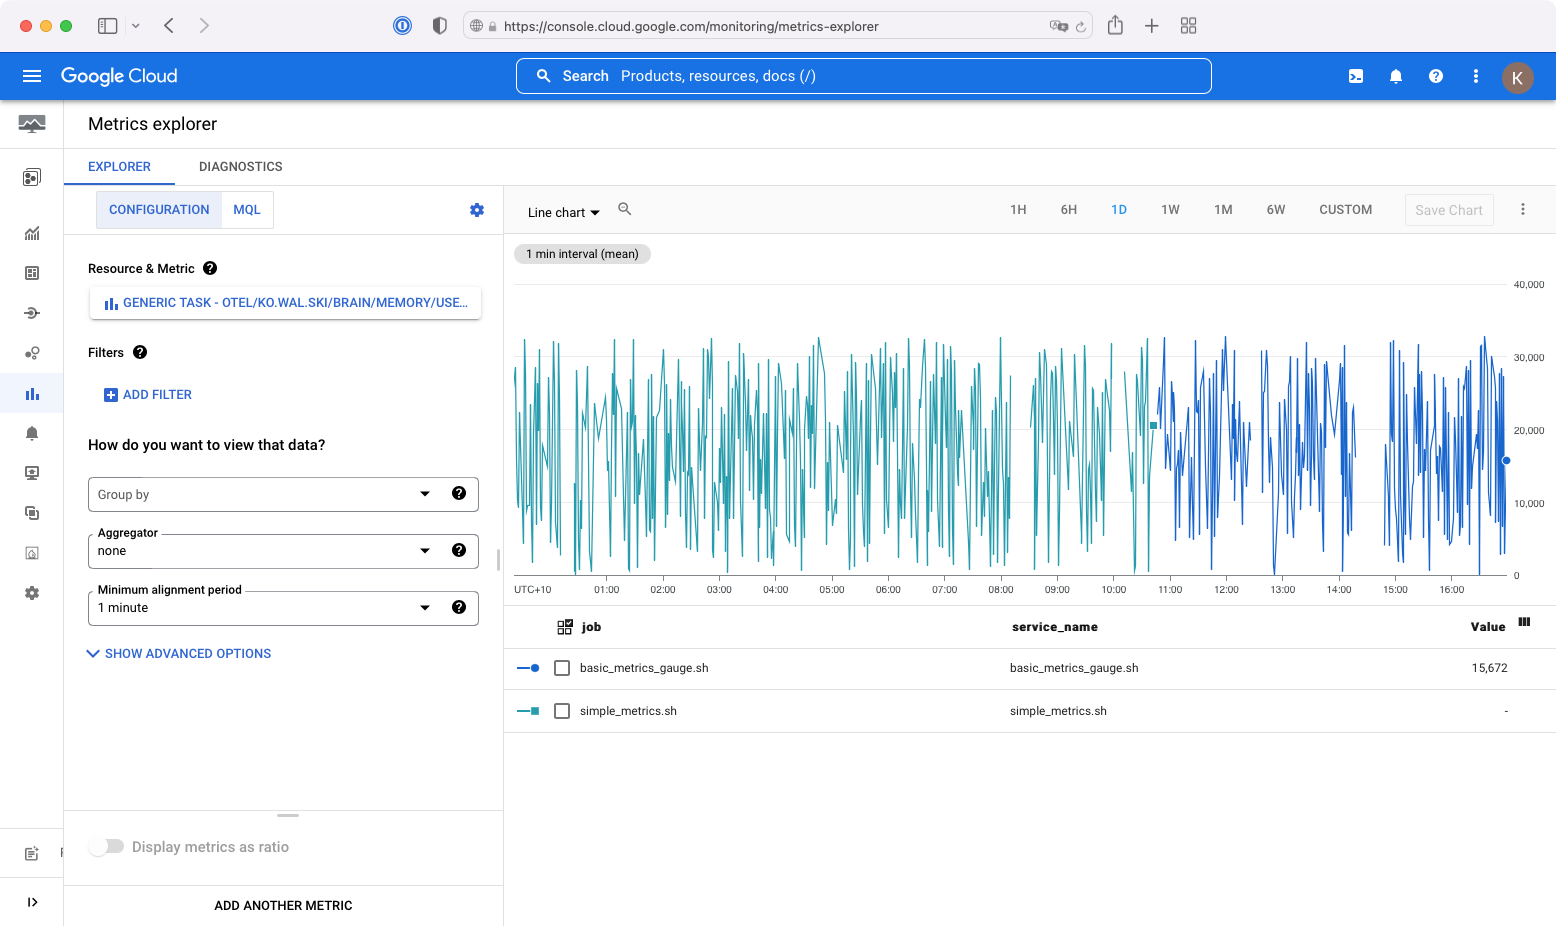
Yields the following:
Simply, . source as follows . opentelemetry-shell/library/otel_traces.sh:
#!/usr/bin/env bash

# Import functions
. opentelemetry-shell/library/otel_traces.sh

# Functions
sleep_for() {
  local sec=$1

  log_info "Sleeping for ${sec} sec..."
  sleep $sec
}

# Start a parent span
otel_trace_start_parent_span sleep_for 1
# Start a child span, associated to the parent
otel_trace_start_child_span sleep_for 2

log_info "TraceId: ${OTEL_TRACE_ID}"
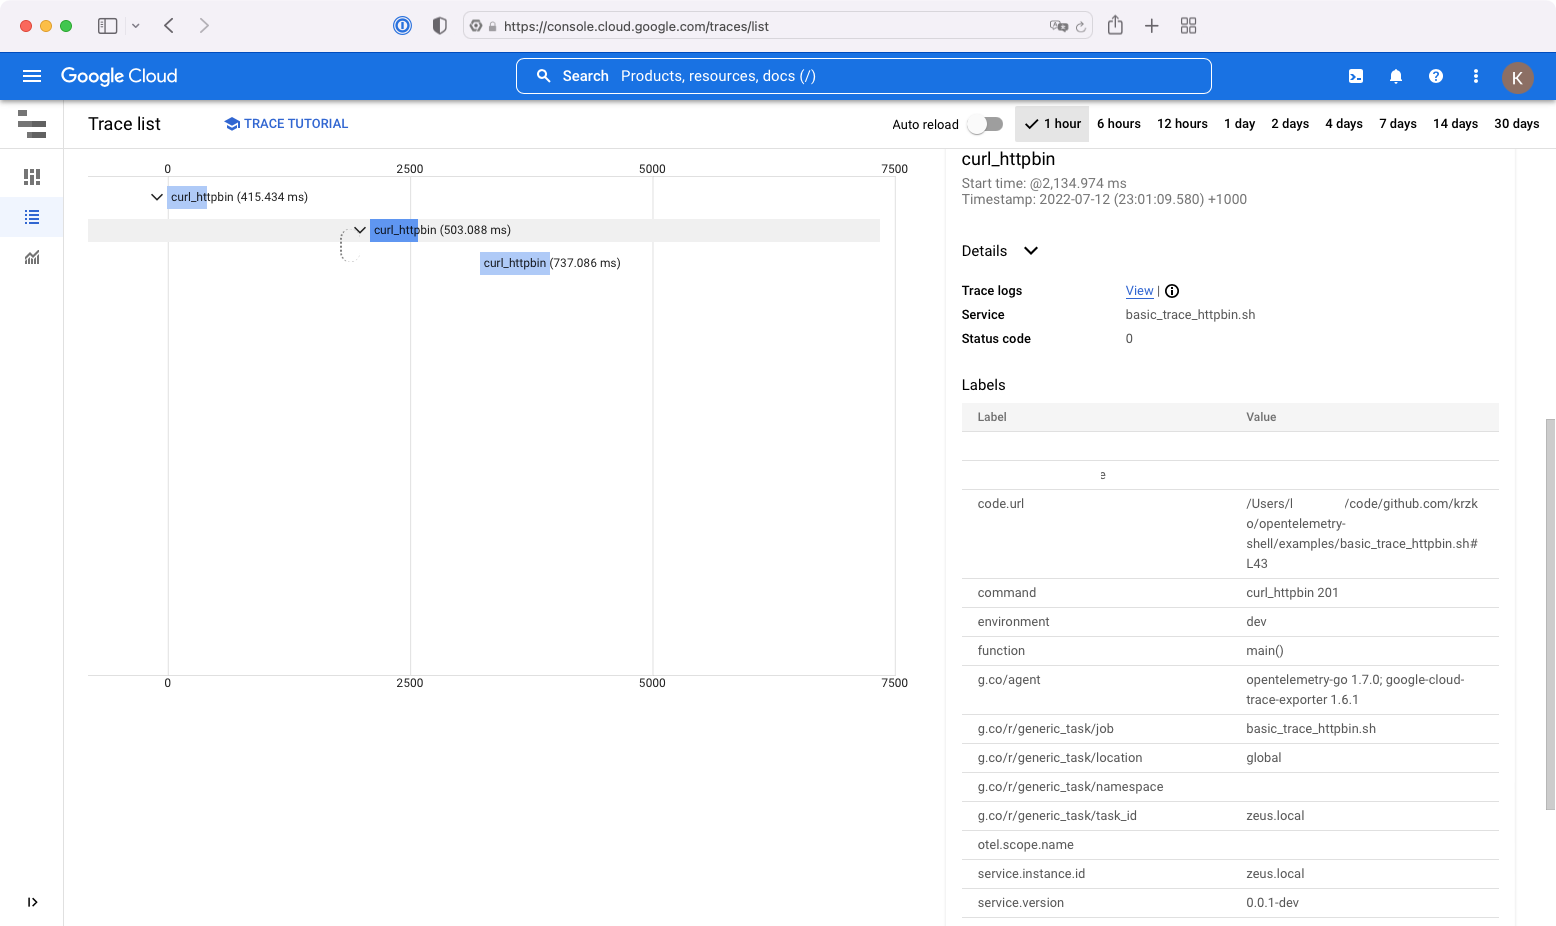
Yields the following:
The project aims to follow the standards of the OpenTelemetry Environment Variable Specification
The following environment variables will be currently used:
OTEL_SERVICE_NAME: Sets the value of theservice.nameresource attributeOTEL_LOG_LEVEL: Log level used by the logger,debug. Unset variable to disable verbose logging
OTEL_EXPORTER_OTEL_ENDPOINT: Exporter endpoint
OpenTelemetry Shell Specific
OTEL_SH_TRACE_ID: Set a pre-definedtraceId. Default behaviour is the functions will create this value for you automatically

