Note: this project is NOT under active development. See rtree-multi for an n-dimensional R-Tree.
Three dimensional R-Tree in java.
- motivated by spatio-temporal queries
- nodes can be serialized to disk or network storage.
- particularly interested in serializing large static datasets into a top tree and many sub-tree files that might be accessed over medium latency and medium bandwidth io (e.g. using AWS S3 from EC2).
Status: pre-alpha
Progress is being made on this project. I've copied my rtree 2D implementation and beefed it up for 3D.
- expanded the R*
SelectorandSplitterimplementations to handle 3 dimensions - enhanced Quadratic
SelectorandSplitterimplementations to handle 3 dimensions - normalized coordinates so they range from 0..1
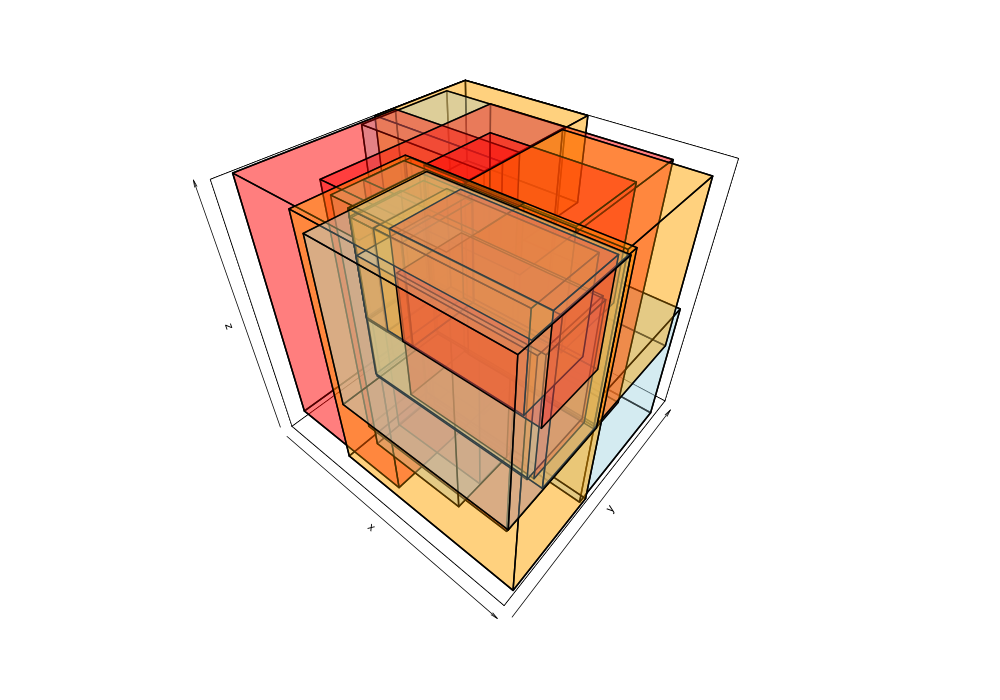
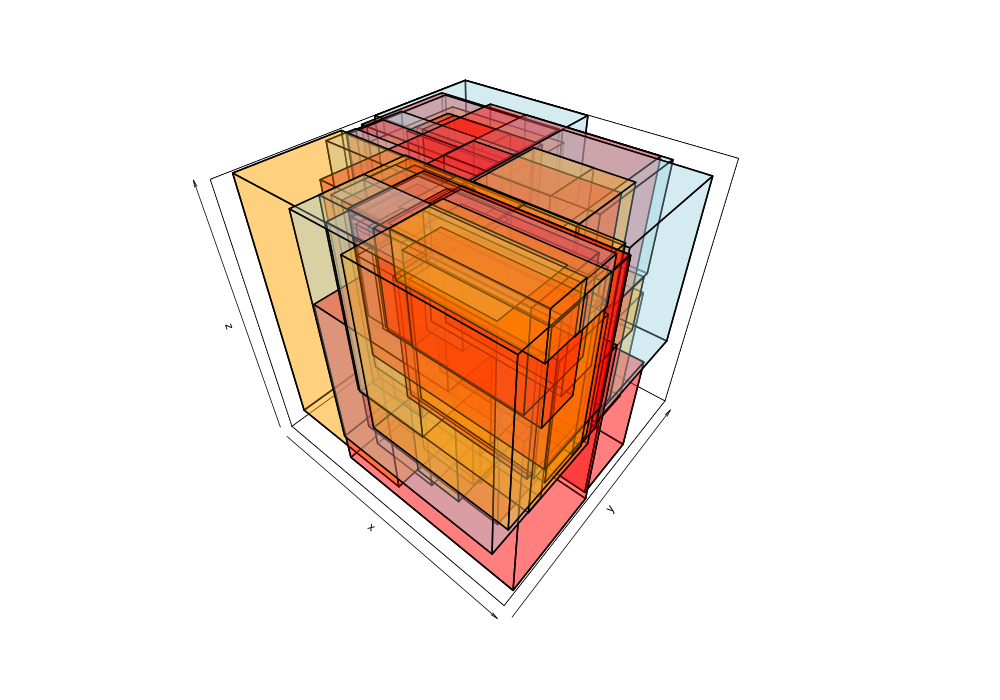
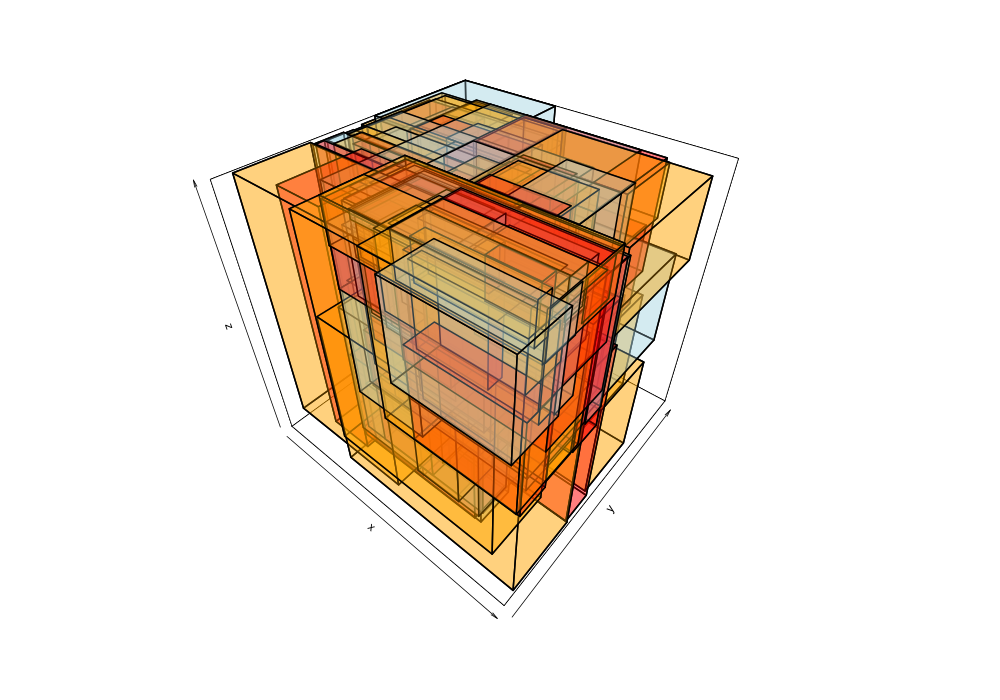
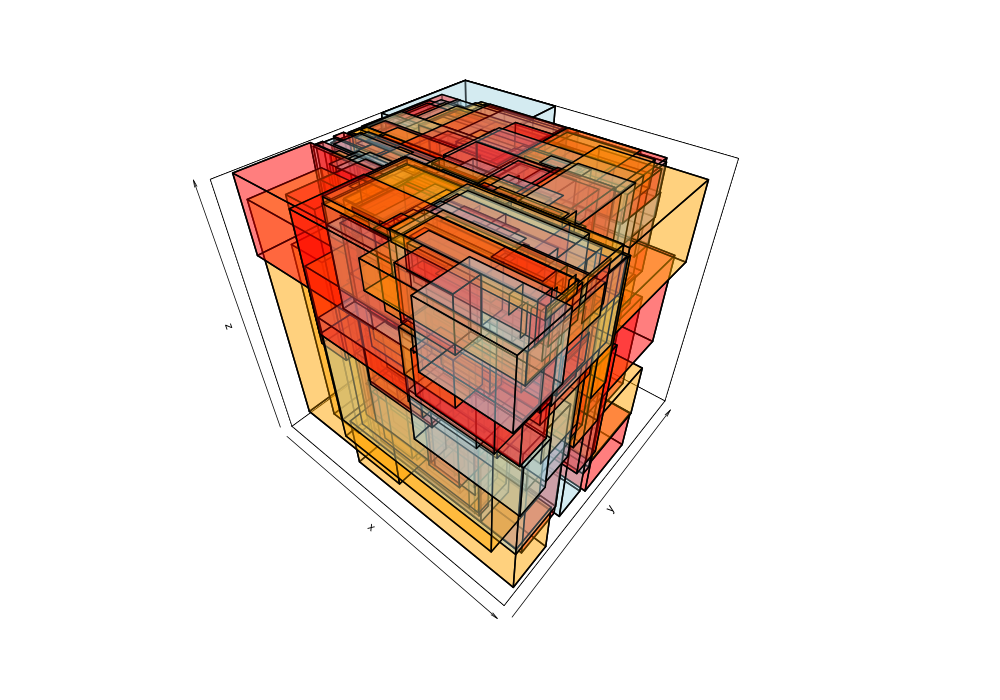
- added R language code to produce PNG visualizations of tree structure (below)
If the coordinates are normalized to the [0..1] range then the data structure doesn't favour one dimension over another. To favour time over position for instance just scale the time value down by a constant (experiment with your data!). Note also that if your entries are added to the R-tree in say ascending time order then the resultant R-tree may be affected negatively in terms of the efficiency of its structure. A useful strategy to avoid this is to shuffle the entries before adding. For example:
RTree<Object, Point> tree =
  tree.add(
    entries
      .toList()
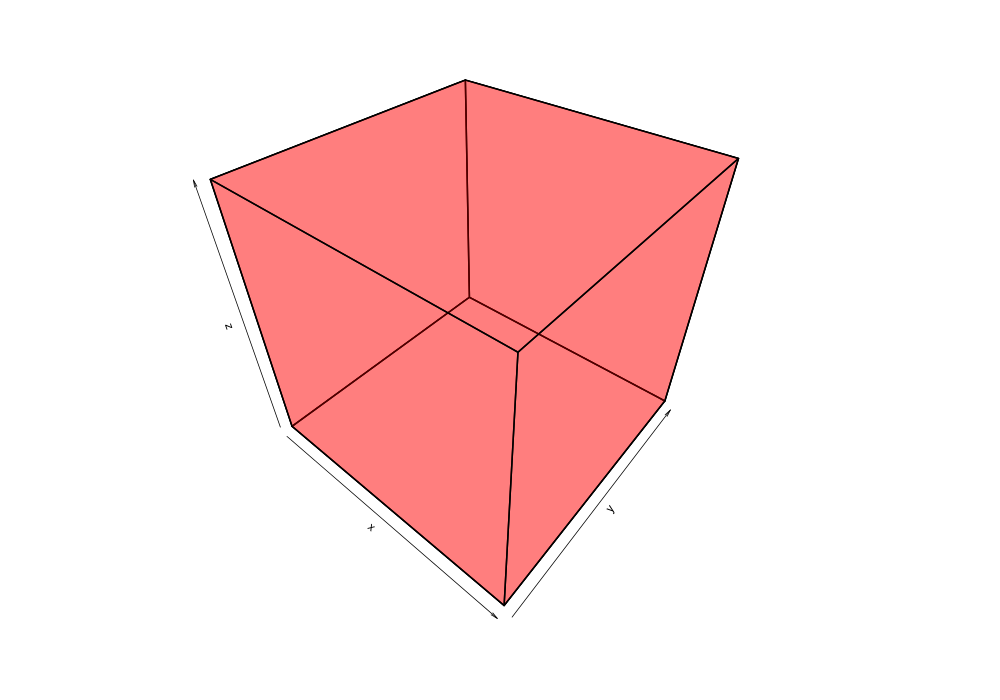
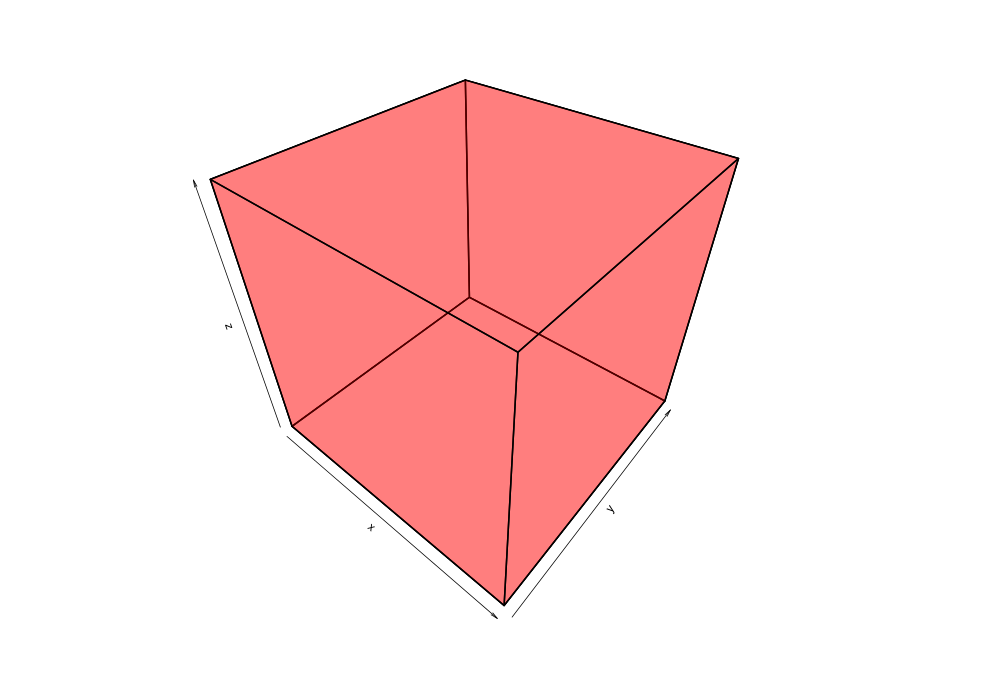
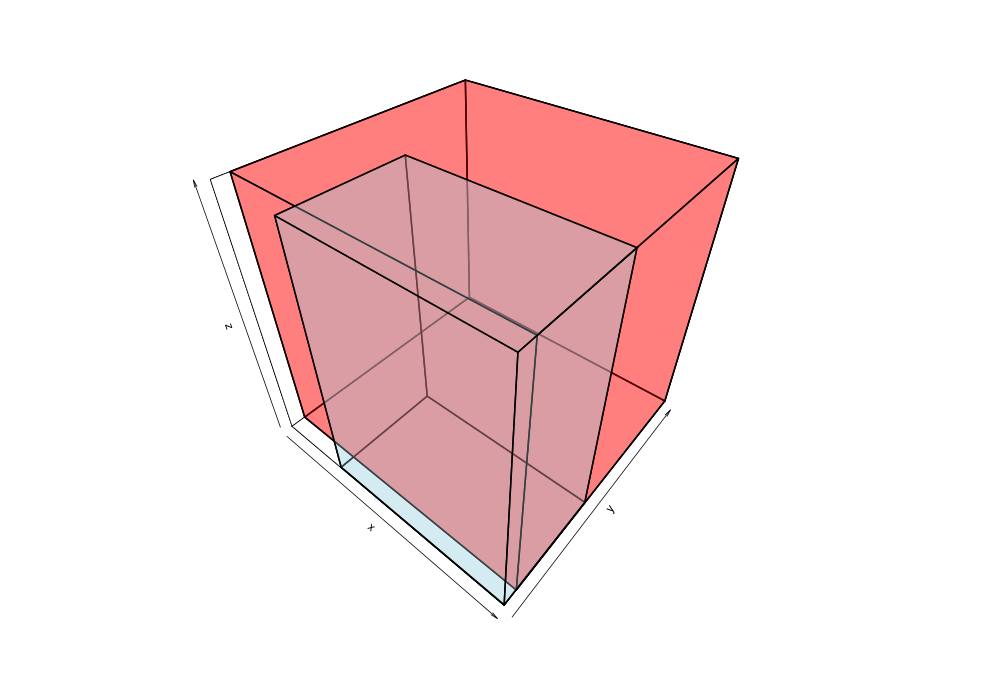
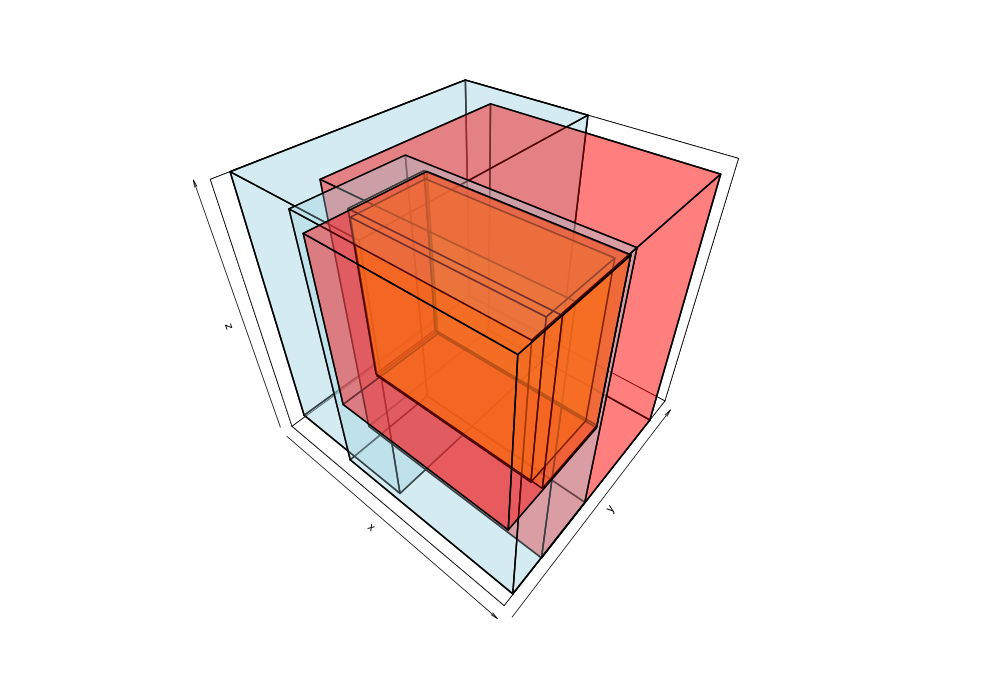
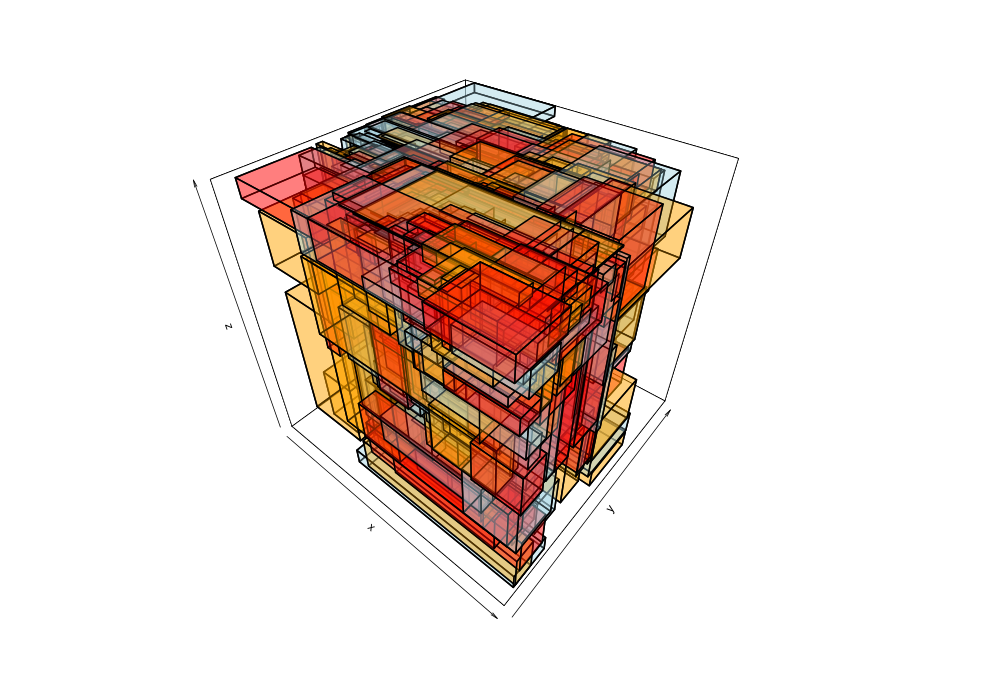
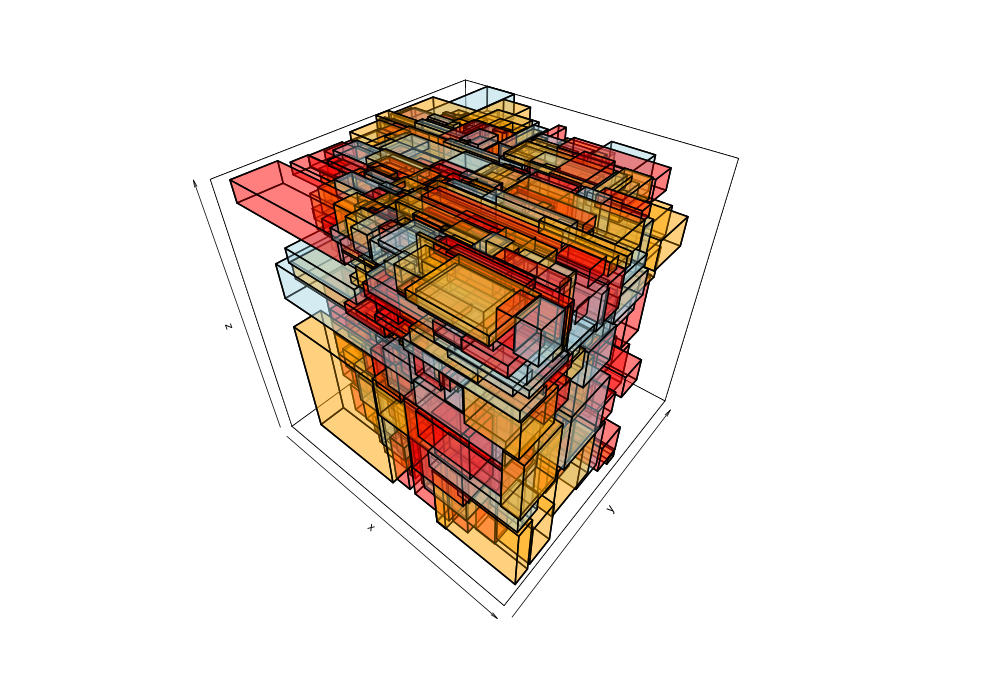
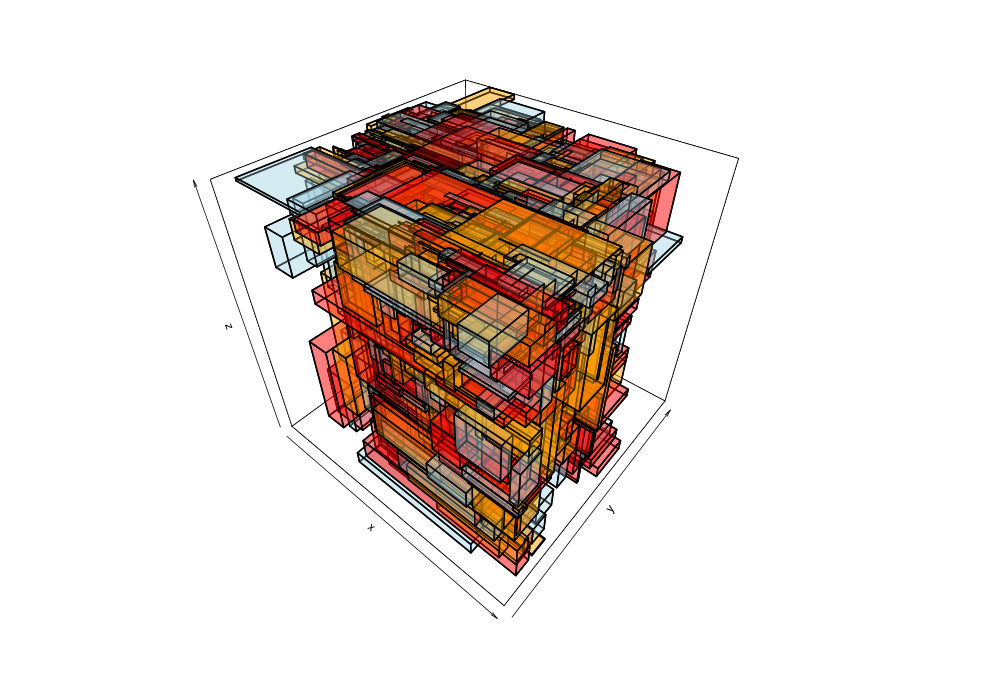
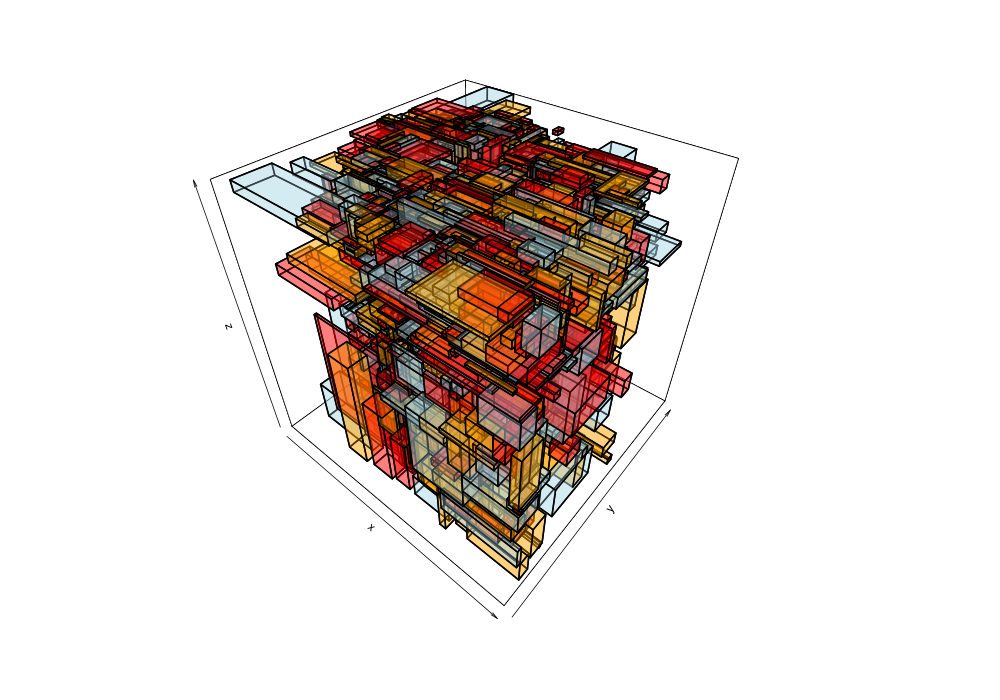
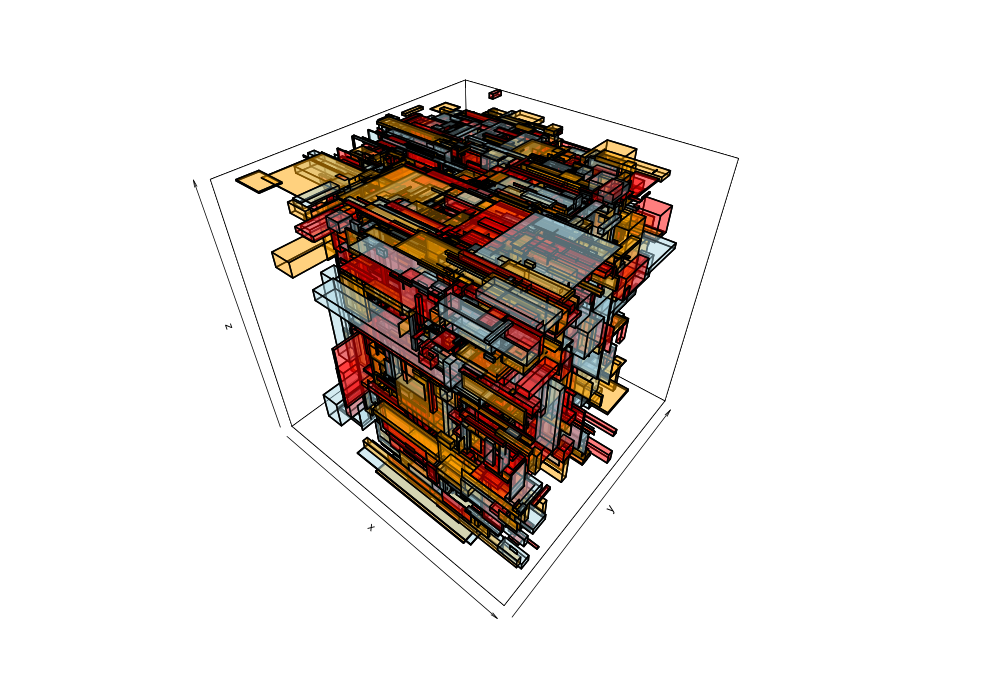
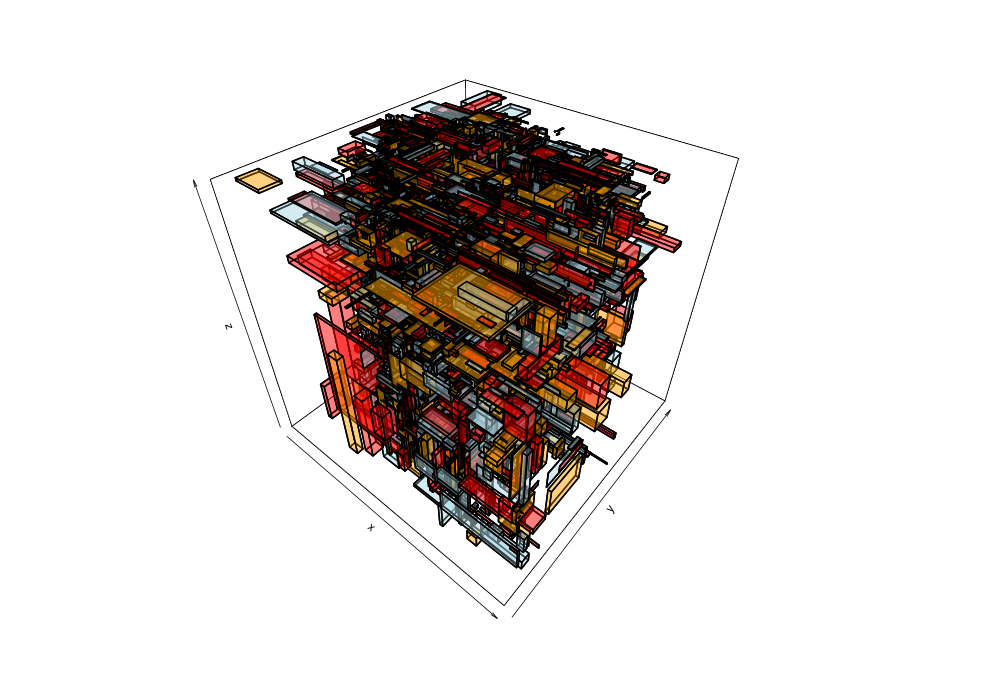
.flatMapIterable(list -> {Collections.shuffle(list);return list}));Given the 38,377 data points of greek earthquakes (lat, long, time) from 1964 to 2000, the data is scanned to establish the ranges for each coordinate then normalized to a [0,1] range. The points are shuffled then added to an R-tree with minChildren=2 and maxChildren=4 using either the R* heuristics or standard R-tree heuristics. Visualization of the bounding boxes at nodes by method and depth is below.
Generated with this commit.
The plots below are generated from the same shuffle of data points.
| Quadratic split | R*-tree split |
|---|---|
 |
 |
 |
 |
 |
 |
 |
 |
 |
 |
 |
 |
 |
 |
 |
 |
 |
 |
 |
 |
Commands to generate:
mvn test
cd src/test/r
./source.r
Images are generated in target directory (plot*.png).