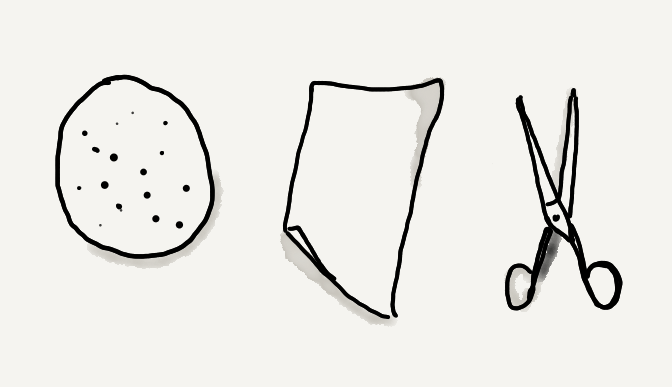
Picture Source: pxt.azureedge.net
This project aims to achieve maximum success by the algorithm in the rock-paper-scissors game together with the reinforcement learning. The achievement of this success will be shaped by the preferences chosen by the user. At the end of each action, the rock, paper, or scissors with the highest beta value and the corresponding value were selected. Compared to the bots that make a random choice, the artificial intelligence model and the integrated model have proven to be more successful in my tests.
The dataset was created automatically. As a result of the values selected from the rock-paper-scissors options selected by the user. There was no educational or training background in the method. The results and the dataset are personal.
In this project, as stated in the title, results were obtained through the Thompson sampling algorithm.
As seen in the formula:
-
First,
$N_i^0(n)$ and$N_i^1(n)$ numbers were calculated for each action.$N_i^0(n)$ = The number of times$0$ received as a reward so far.$N_i^1(n)$ = Number of times$1$ received as a reward so far. -
Secondly, a random number is generated in the beta distribution specified in the formula for each claim.
-
Finally, we took the value with the highest beta value. This value will indicate the option the algorithm will play against us.
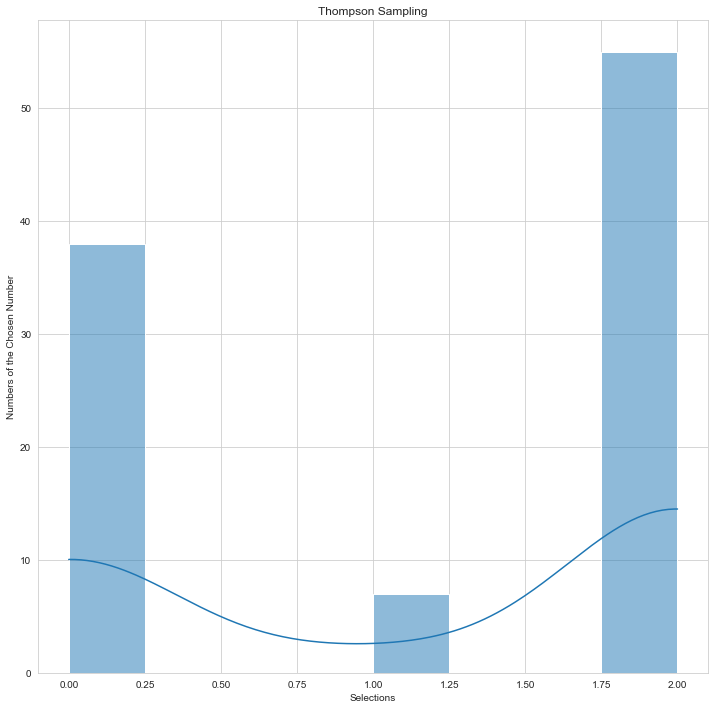
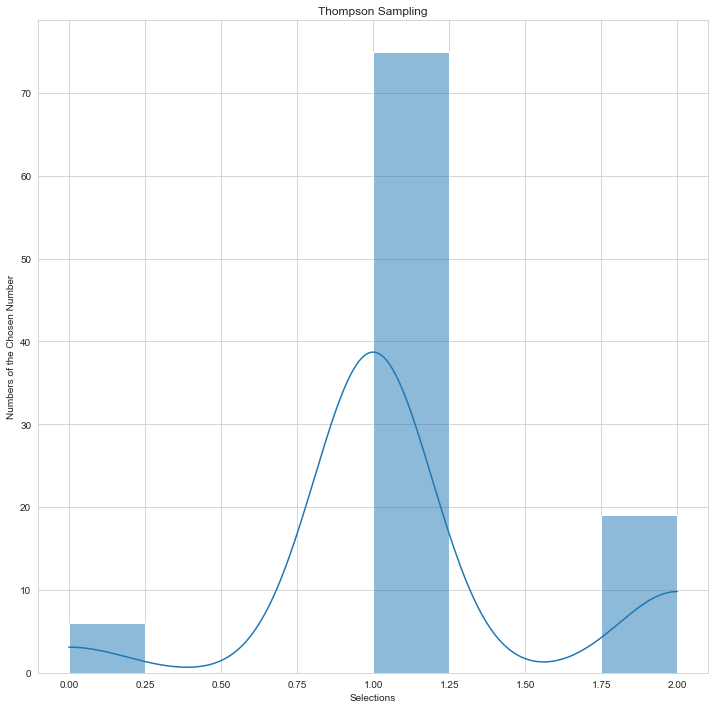
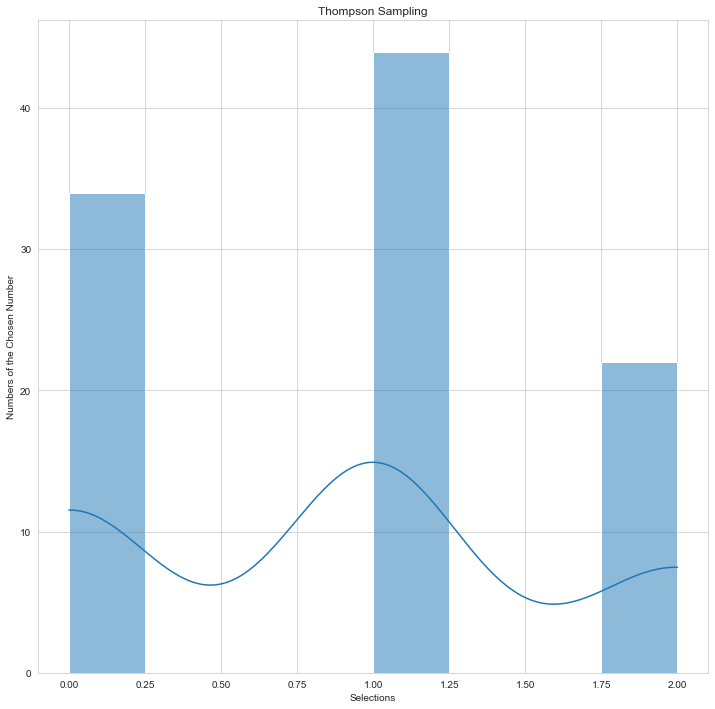
The results were showed on the histogram at the end of each operation. In other words, the tendency of the sampling was indicated on the histogram. Thompson sampling was much more successful than a random choose.
def thompson_sampling(df):

    N = df.shape[0]  # Number of rows
    d = df.shape[1]  # Number of ads (columns)
    summation = 0  # Summation reward
    chosen = []  # Ni(n)
    ones = [0] * d
    zeros = [0] * d
    for n in range(1, N):
        ad = 0  # Chosen
        max_th = 0
        for i in range(0, d):
            rasbeta = random.betavariate(ones[i] + 1, zeros[i] + 1)
            if rasbeta > max_th:
                max_th = rasbeta
                ad = i
        chosen.append(ad)
        reward = df.values[n, ad]
        if reward == 1:
            ones[ad] = ones[ad] + 1
        else:
            zeros[ad] = zeros[ad] + 1
        summation = summation + reward

    chosen.append(randint(0, 2))
    thompson=np.bincount(chosen).argmax()
    print(f"Summation: {summation} - Thompson sampling: {thompson}")

    plt.figure(figsize = (12, 12))
    sns.set_style('whitegrid')
    sns.histplot(data=chosen, kde=True)
    plt.title("Thompson Sampling")
    plt.xlabel("Selections")
    plt.ylabel("Numbers of the Chosen Number")
    plt.show()

    return thompson
You are free to visit Thompson sampling Wikipedia website for learn the method better.
The general outline of the game was created below. Then the game continued until the user pressed the q key, with a while loop.
wins = 0
loses = 0
draws = 0
d = pd.DataFrame(columns=['r', 'p', 's'])

rock_row = {'r': 1, 'p': 0, 's': 0}
paper_row = {'r': 0, 'p': 1, 's': 0}
scissors_row = {'r': 0, 'p': 0, 's': 1}

while True:

    user_action = input("Enter a choice (rock, paper, scissors): ")

    if user_action == 'q':
	print("\n\nYou have completed the duel.")
	print("\nTHOMPSON SAMPLING")
	thompson_sampling(d)
	print(f"Loses: {loses}")
	print(f"Wins: {wins}")
	print(f"Draws: {draws}")
	print(f"Rock-Paper-Scissors DataFrame:\n{d}\n")
	break

    # Thompson Sampling
    thompson_choose=thompson_sampling(d)
    if thompson_choose== 0:
	computer_action="paper"
    elif thompson_choose == 1:
	computer_action="scissors"
    else:
	computer_action="rock"

    # User
    if user_action == "rock":
	d = d.append(rock_row, ignore_index=True)
    elif user_action == "paper":
	d = d.append(paper_row, ignore_index=True)
    elif user_action == "scissors":
	d = d.append(scissors_row, ignore_index=True)
    else:
	print("Unexpected input.")

    print(f"You chose {user_action}, computer chose {computer_action}.")
    if user_action == computer_action:
	print(f"Both players selected {user_action}. It's a TIE!")
	draws += 1
    elif user_action == "rock":
	if computer_action == "scissors":
	    print("Rock smashes scissors! You WIN!")
	    wins += 1
	else:
	    print("Paper covers rock! You LOSE.")
	    loses += 1
    elif user_action == "paper":
	if computer_action == "rock":
	    print("Paper covers rock! You WIN!")
	    wins += 1
	else:
	    print("Scissors cuts paper! You LOSE.")
	    loses += 1
    elif user_action == "scissors":
	if computer_action == "paper":
	    print("Scissors cuts paper! You WIN!")
	    wins += 1
	else:
	    print("Rock smashes scissors! You LOSE.")
	    loses += 1
Thompson Sampling Results
The histogram specified in ts_histogram.png shows the distribution of the last round. In line with the preferences, the algorithm obtained inferences from the user's preferences and only 1 win was obtained in 12 rounds. The system made a random choice only in the first round.
You can find detailed preferences and results in console_ts.xml.
Loses: 5
Wins: 1
Draws: 6
Random Selection Results
Loses: 1
Wins: 6
Draws: 5
These results show only one of the obtained results. Many more virtual duels can be created and hypothesis tested through various loops. As can be understood, Thompson sampling prevailed more.
Within the scope of this project, 100 different games were simulated to reach more detailed inferences and results. In total, we simulated 300 games; Random vs. Random, Random vs. Thompson sampling, and finally Thompson sampling vs. Thompson sampling. These results were performed using Thompson sampling 1 and Random Selection 1.
Rounds Probabilities
| Random Selection | Thompson Sampling | |
|---|---|---|
| Random Selection | Win: %35, Lose: %37, Draw: %28 | Win: %25, Lose: %38, Draw: %37 |
| Thompson Sampling | Win: %38, Lose: %25, Draw: %37 | Win: %44, Lose: %48, Draw: %8 |
The decisions made per round played were created as dataframes and then saved in different files in .xlsx format. There are two different excel files for each situation. This is because there are two different game players. A different dataframe was created for each player.
- Random Selection vs Random Selection
- Random Selection vs Thompson Sampling
- Thompson Sampling vs Thompson Sampling
| Thompson Sampling 1 | Thompson Sampling 2 |
|---|---|
 |
 |
Picture Source: Doğu İlmak GitHub
You can examine the preference distribution of two different Thompson sampling users on the above-mentioned histogram graphs.
Picture Source: Doğu İlmak GitHub
You can examine the preference distribution Random selection and Thompson sampling users on the above-mentioned histogram graphs.
If you have something to say to me please contact me:
- Twitter: Doguilmak
- Mail address: [email protected]

