I have a Goodwe GW5048-ESA inverter installed at home and the applications provided (PV Master and SEMS portal) are not enough to monitor the data the way I want.
While they work, PV Master is extremely slow to use (at least on Android phone) and the SEMS portal is good and provides historic data but it's an online service, so if I don't have internet connectivity I can't see the stats over the last X hours, and why should I have to go online when I have the inverter at home? 😉
This project came out of the necessity to monitor my solar inverter without the need to connect to any of those apps, so I wrote a small NodeJS program to pull some stats and store/display them the way I wanted.
At the time I started this project there was no Home Assistant integration yet, but I do see there is one now which might be better, but either way if you like tinkering and decide to experiment with a Docker installation keep reading.
Please note this code is for my particular inverter model, if you have something different you can reuse pieces and adapt to yours (even if it's not a Goodwe one). I built the containerized solution, wrote some pieces of code, used some parts of other projects, and even disassembled PV Master to try and figure out how to read some values. I'll add links at the bottom for reference. Good luck! 😀
The only thing that is needed is Docker to run the containers. How it works is out of scope for this repo, there are plenty of tutorials out there for you to learn.
Also in my particular setup I have it under a Traefik proxy, but I thought it was overkill for this simple repo.
You just have to clone it and modify the file ./nodejs-solarapp/src/index.js to change the IP address of your inverter and put the one from yours:
...
const port = process.env.PORT || 9876;

const inverterAddress = '192.168.1.150'; // Replace your IP address here
const message = functions.hexToBytes('aa55c07f0106000245');

const GridInOutMode = {
...
If some of the ports used in this configuration collide with ones you already have, just do a global search in the solution and replace with the ones you wish.
Then if you're happy with the remaining settings for ports and such just build the images:
docker compose buildAnd finally spin the containers up:
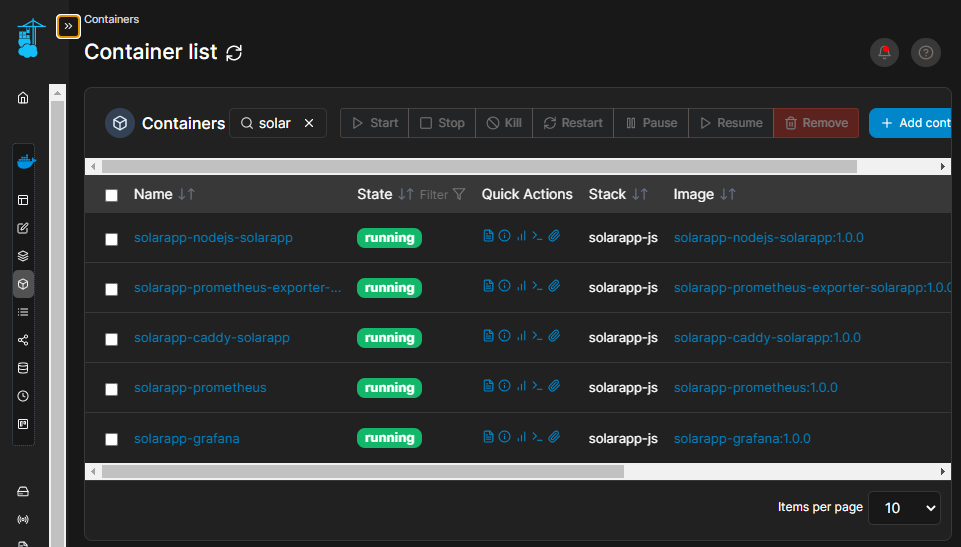
docker compose up -dYou should be able to see them (for example in Portainer):
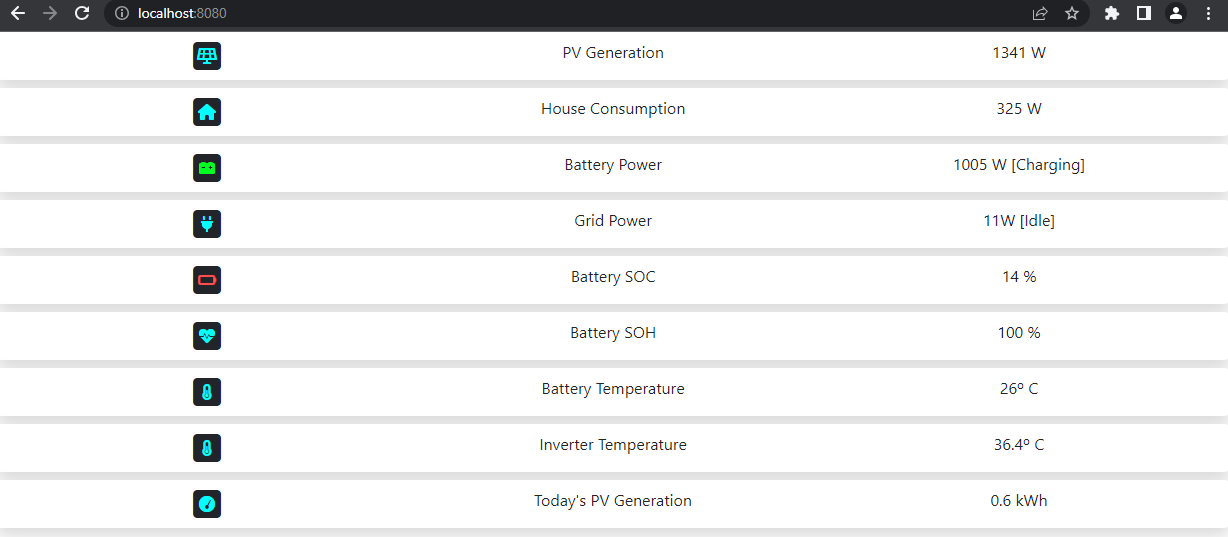
The main app is located at http://localhost:8080 which will give you the current status of the inverter:
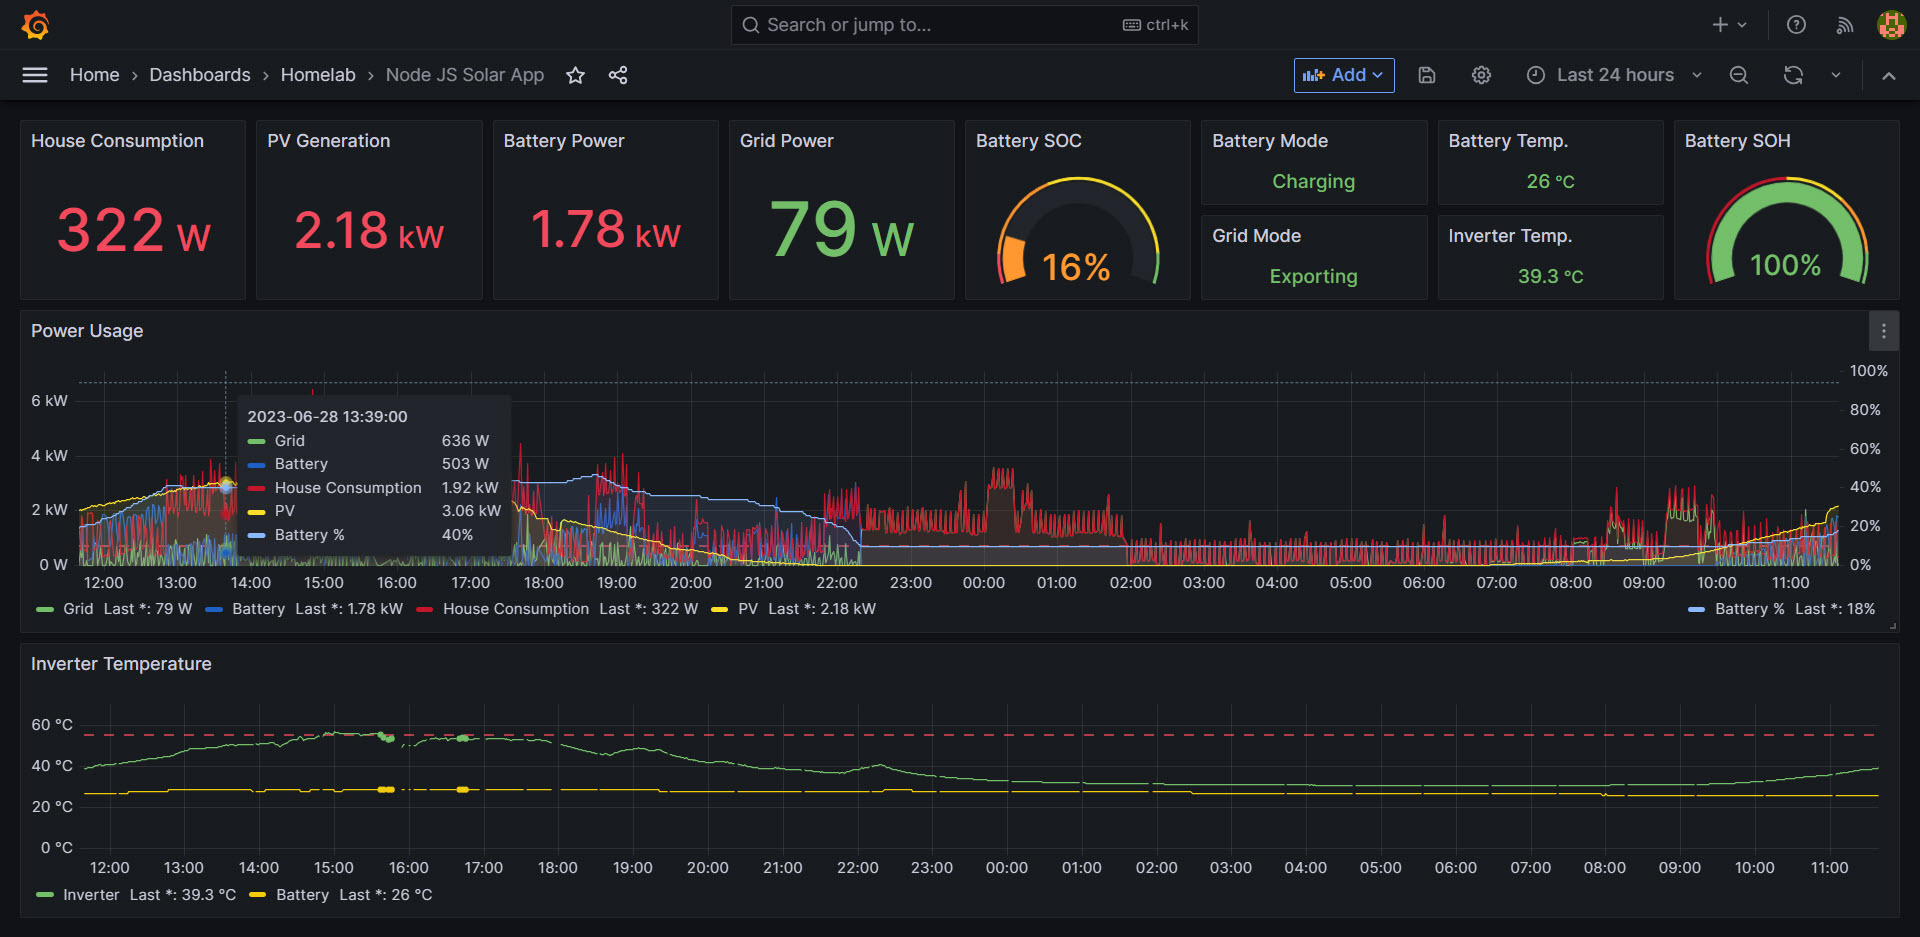
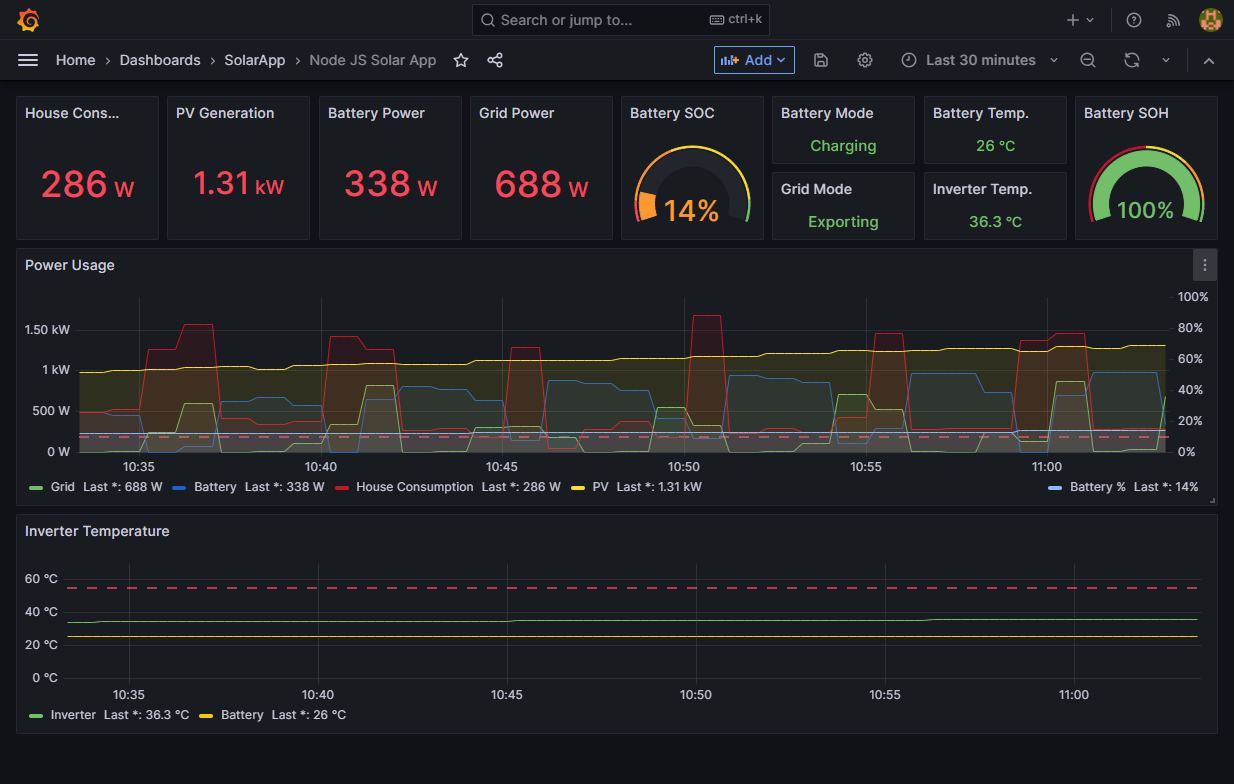
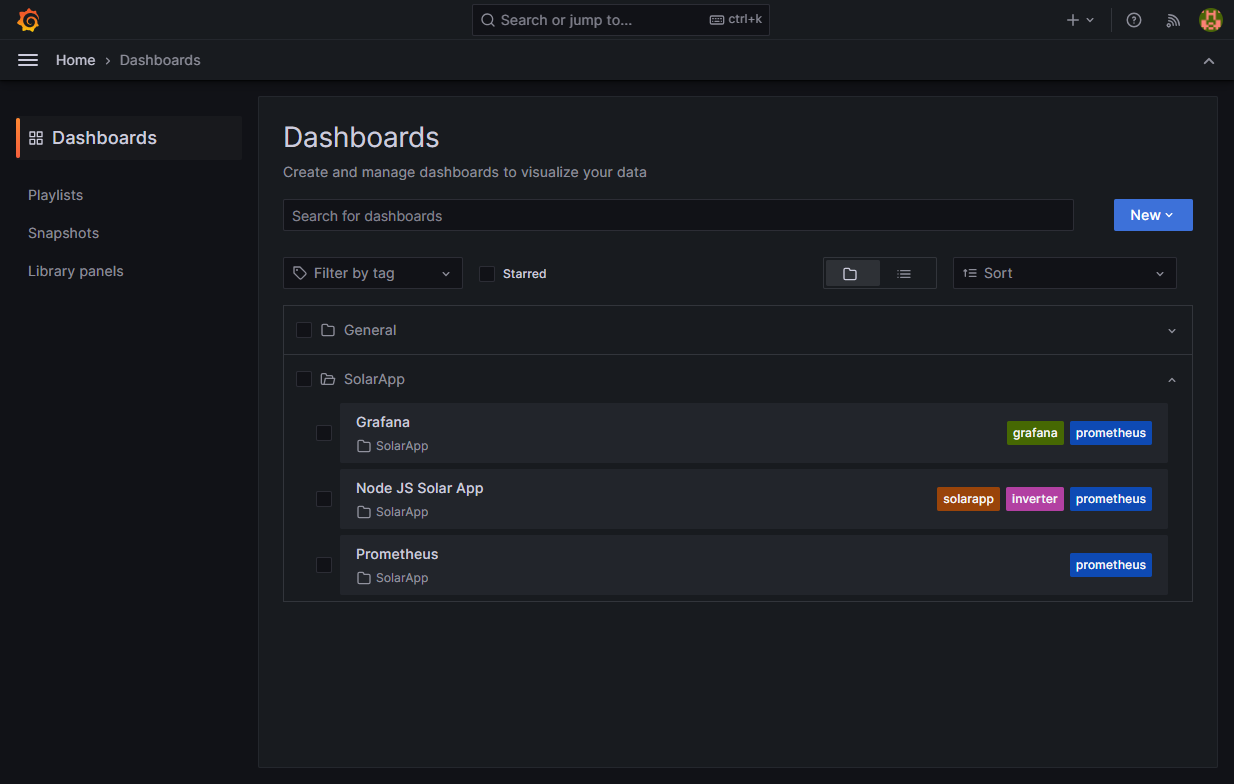
I have also included a Grafana instance with some predefined dashboards so you can query the data in a more visual way, you just need to browse to http://localhost:3000 and check the provisioned dashboards.
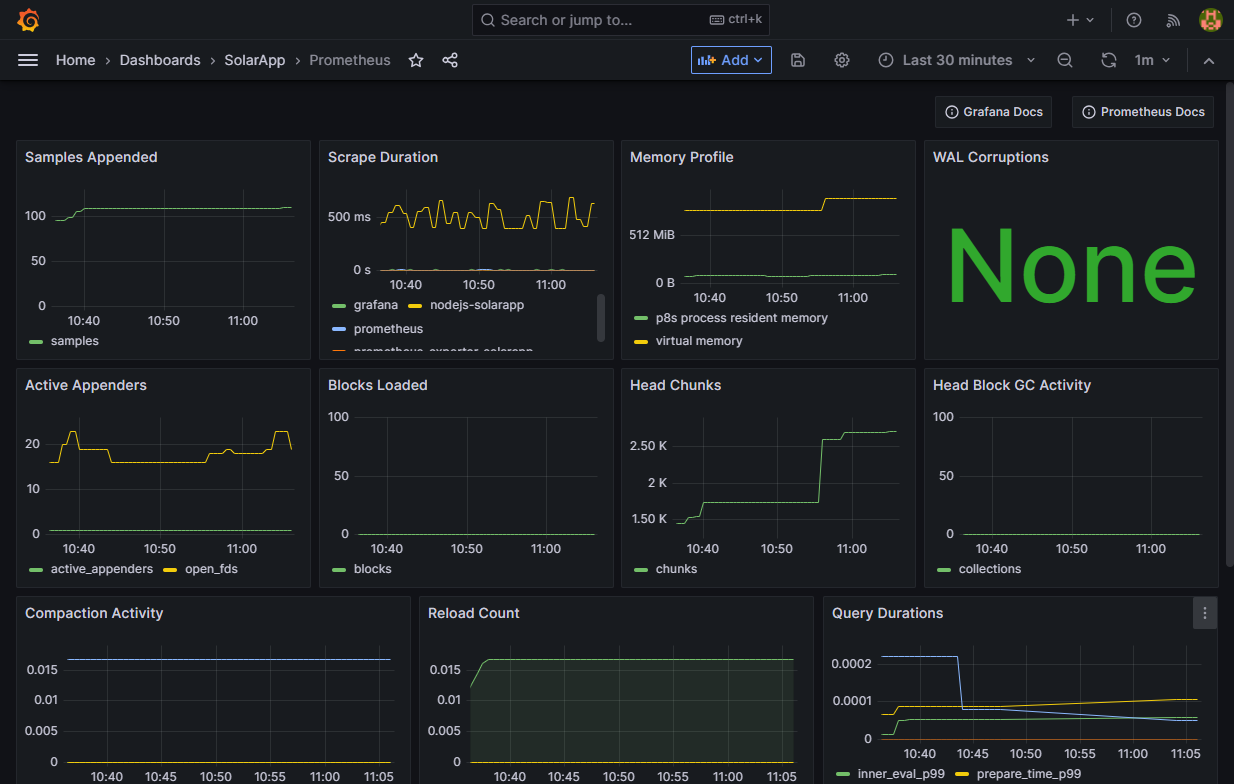
There are three dashboards included in this Grafana instance:
- NodeJS Solar App provides the main stats of the inverter.
- Prometheus provides Prometheus' own stats.
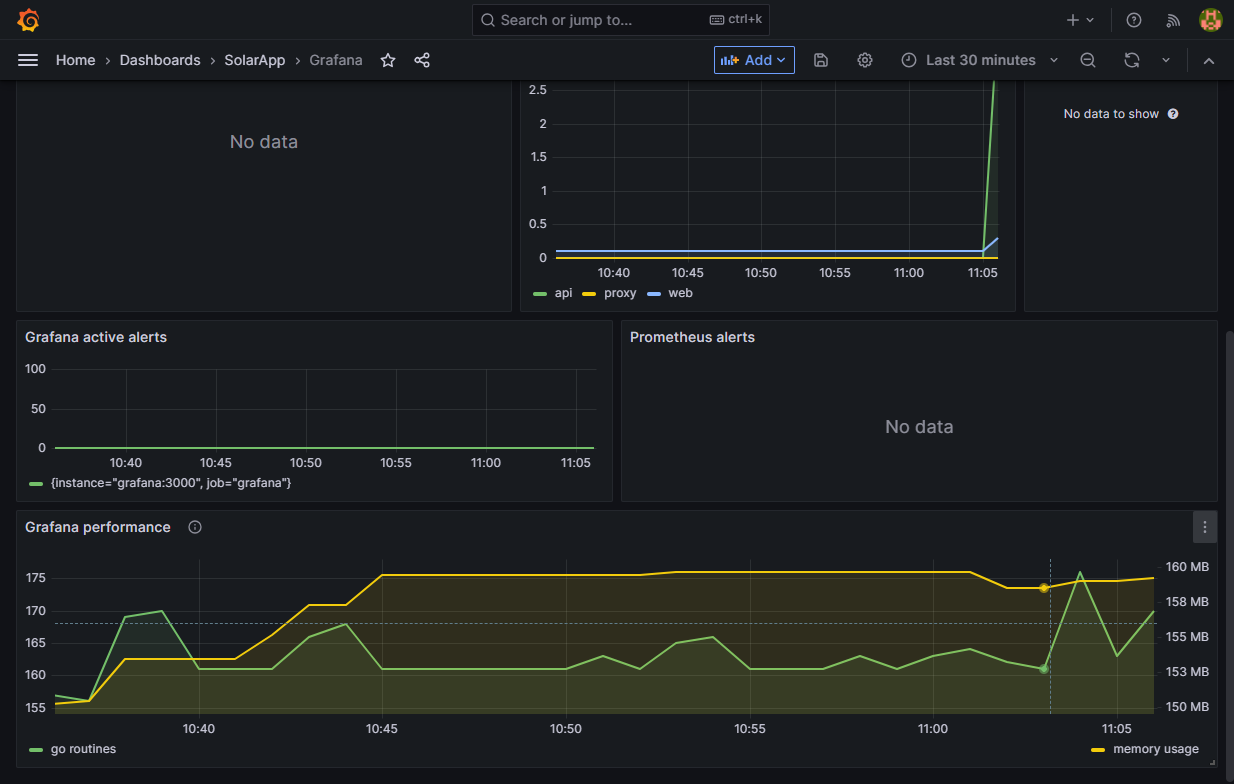
- Grafana provides Grafana's stats
They may not be 100% ok but for the purposes of what I need they work just fine.
Once the containers are up and running, you can access the endpoints via a regular browser in the following addresses:
- http://localhost:8080 => Main UI, gives the actual status
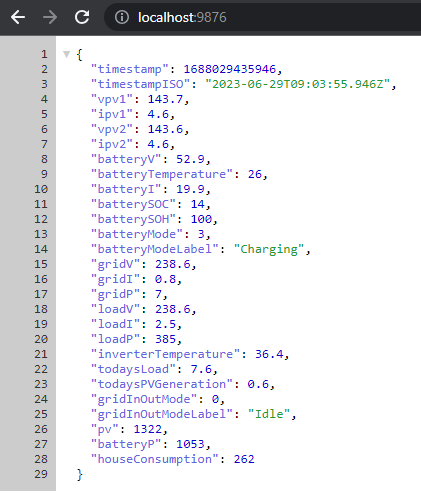
- http://localhost:9876 => NodeJS app to query actual stats, returns JSON
- http://localhost:7979/metrics => Prometheus exporter for the statistics
The default credentials defined in the docker_compose.yml file are admin/password, feel free to change them to whatever you like.
- http://localhost:3000 => Main UI
- http://localhost:3000/metrics => Prometheus metrics endpoint
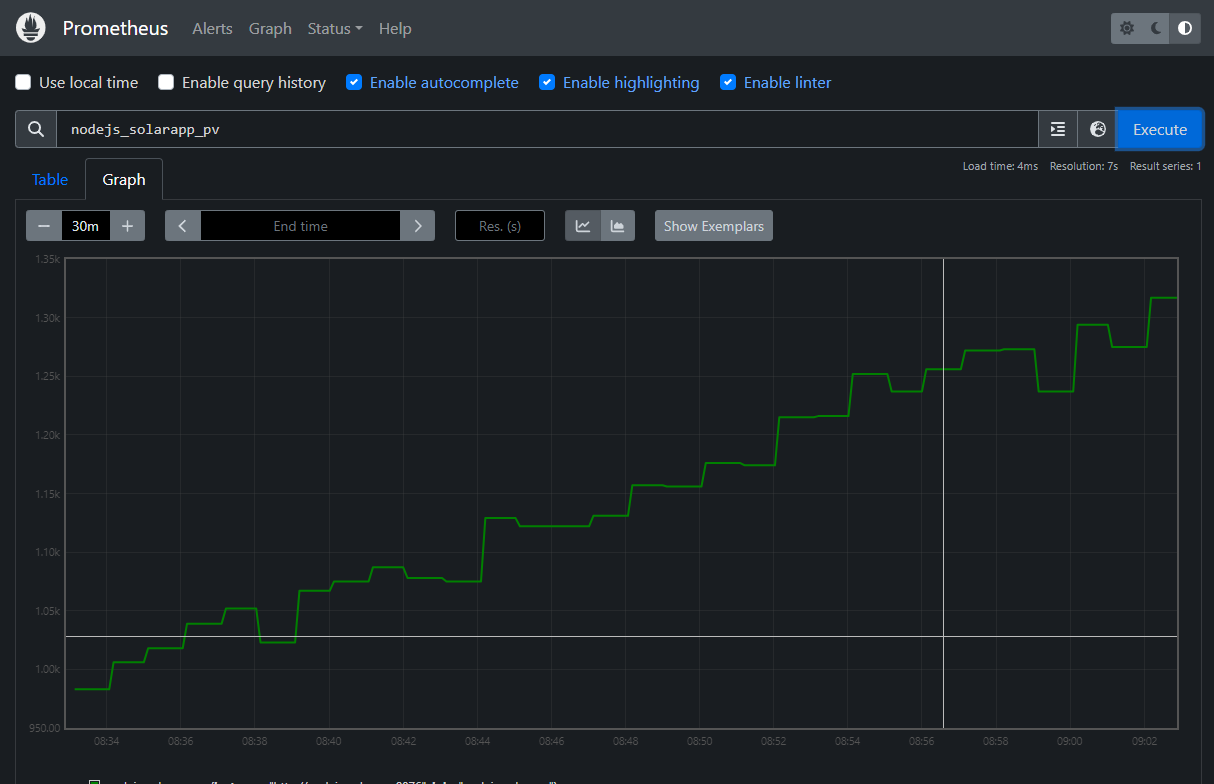
- http://localhost:9090 => Main UI
- http://localhost:9090/metrics => Prometheus metrics endpoint
Goodwe doesn't provide documentation on how to access inverter data via UDP, so I used as reference the work of other people to pick the pieces I would need, as well as some disassembling, these are the ones I can remember:
- https://github.com/mletenay/home-assistant-goodwe-inverter
- https://github.com/marcelblijleven/goodwe
As such, I think some calculations might not be accurate 100%, especially the ones regarding the PV daily generation, as I do see a weird offset compared to what I see on the SEMS portal but again, in the portal I do not see the inverter temperature for some reason when I get a report (even though it IS being generated and I DO see it in realtime) so not a big deal.
Also, I have the polling for stats with Prometheus every minute. If you lower it you can get more detailed information but for some reason the inverter my become "overloaded" and not respond correctly. You may also see blanks in the capture points but again, not a big deal for me.
The code is provided as-is, you can download and use it in any way you like, just remember this is for my particular model, so you'll need to change it if you need anything different.
Finally if you like this you can also buy me a coffee. 😎
Thanks, I hope you enjoy this project!
