
Grab the latest events from the boring GitHub's API and build an entertaining graph upon them!
Check out the releases section for ready-to-run binaries, with all the needed dependencies already embedded. Here's the latest one!
Given that your $PATH already has $GOPATH/bin in it, get the package and install it these commands:
$ go get github.com/nmaggioni/hubgraph
$ cd $GOPATH/src/github.com/nmaggioni/hubgraph
$ ./build.sh
$ go install
HubGraph has some useful command line options, you can check them by using the help flag:
$ ./hubgraph -h
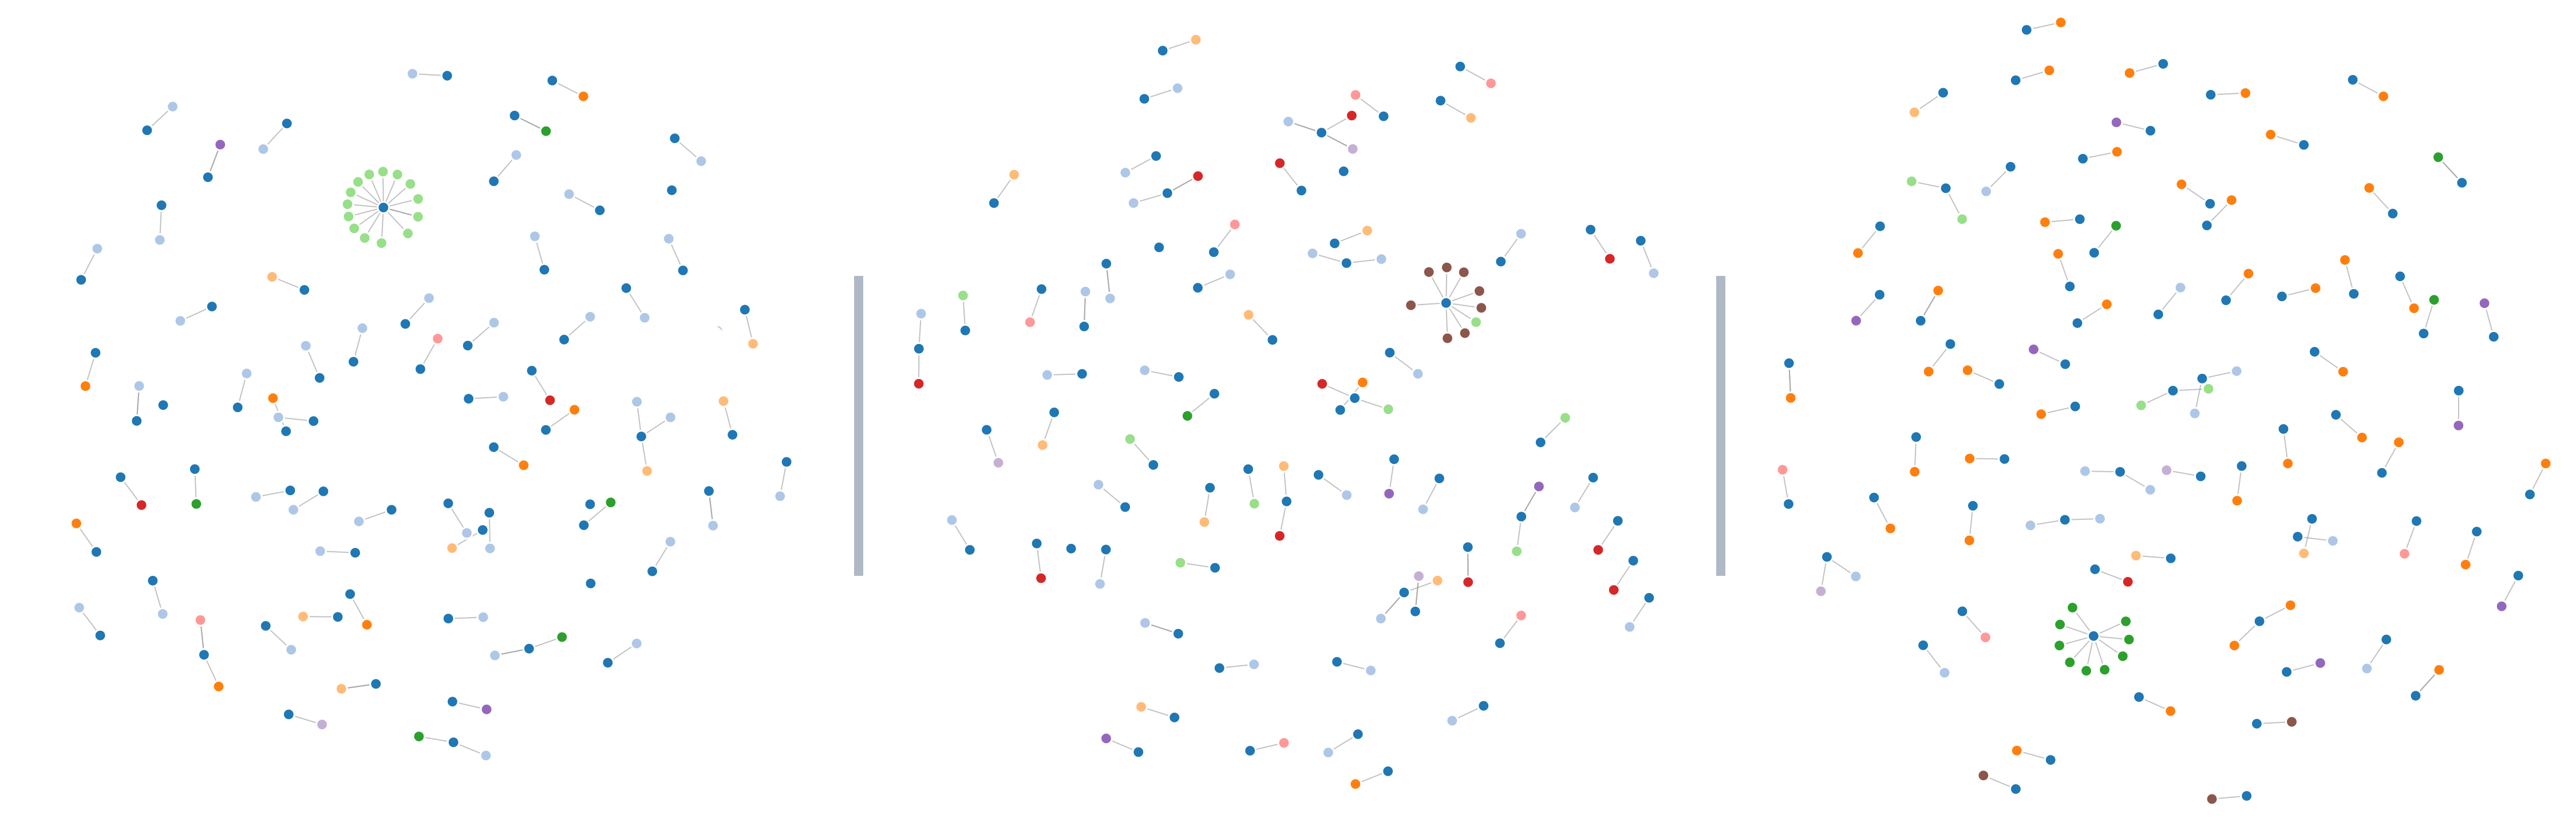
Here are three examples of what HubGraph will produce: the blue points are repositories, and other coloured nodes linked to them are related events. Dark green, for example, is for when an issue has been commented, yellow for a new commit pushed, light blue for new PRs submitted, and so on... Place the mouse over a node to read its description!
PRs gladly accepted! Basing them on a new feature/fix branch would help in reviewing.
Small note: If editing the Readme, consider conforming to the standard-readme specification.