Note: Fork of https://github.com/catchpoint/workflow-telemetry-action with Proxy support and result as Run check
A GitHub Action to track and monitor the
- workflow runs, jobs and steps
- resource metrics
- and process activities of your GitHub Action workflow runs. If the run is triggered via a Pull Request, it will create a comment on the connected PR with the results and/or publishes the results to the job summary.
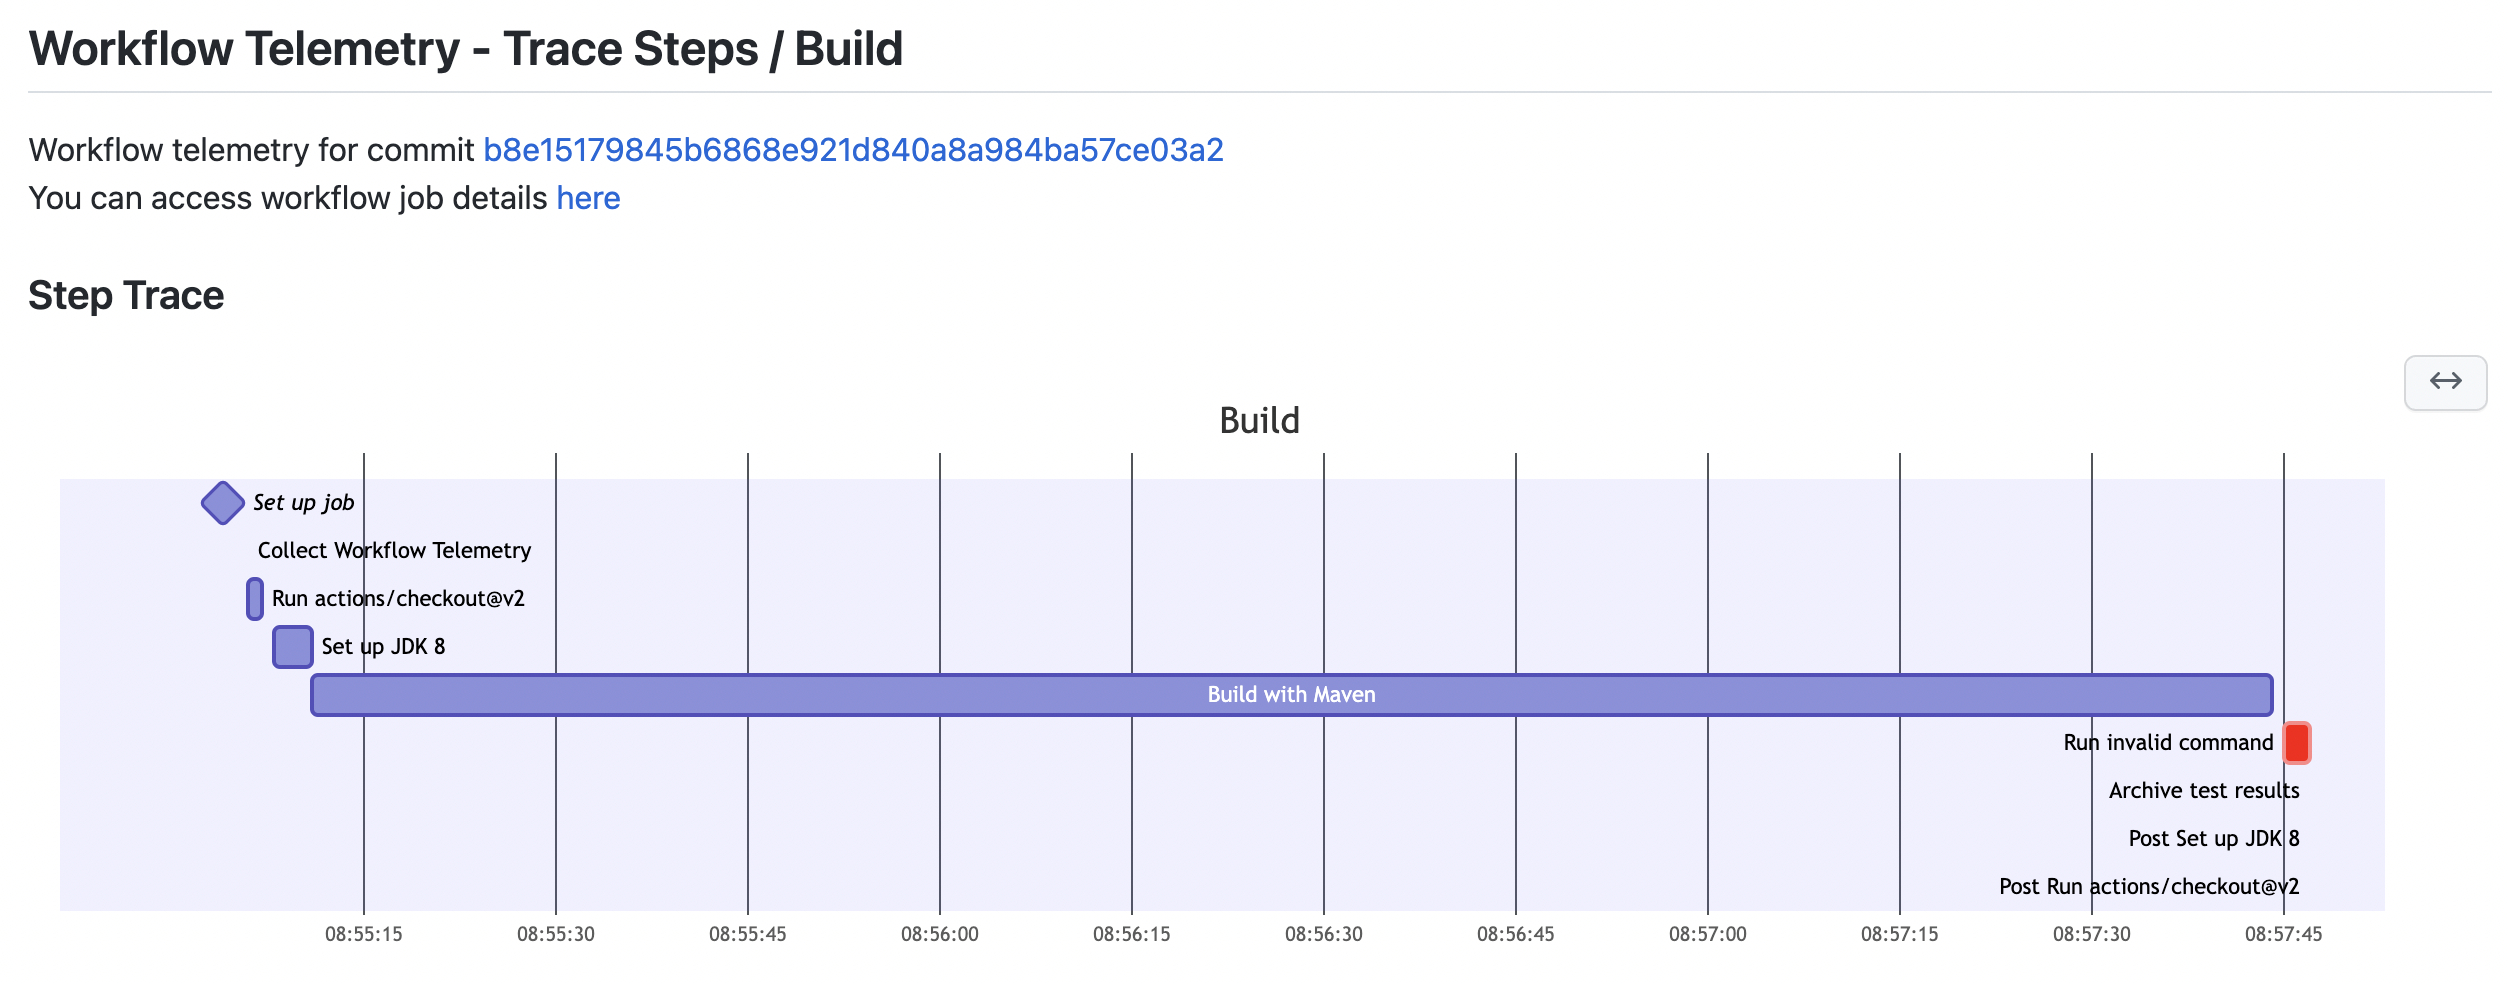
The action traces the jobs' step executions and shows them in trace chart,
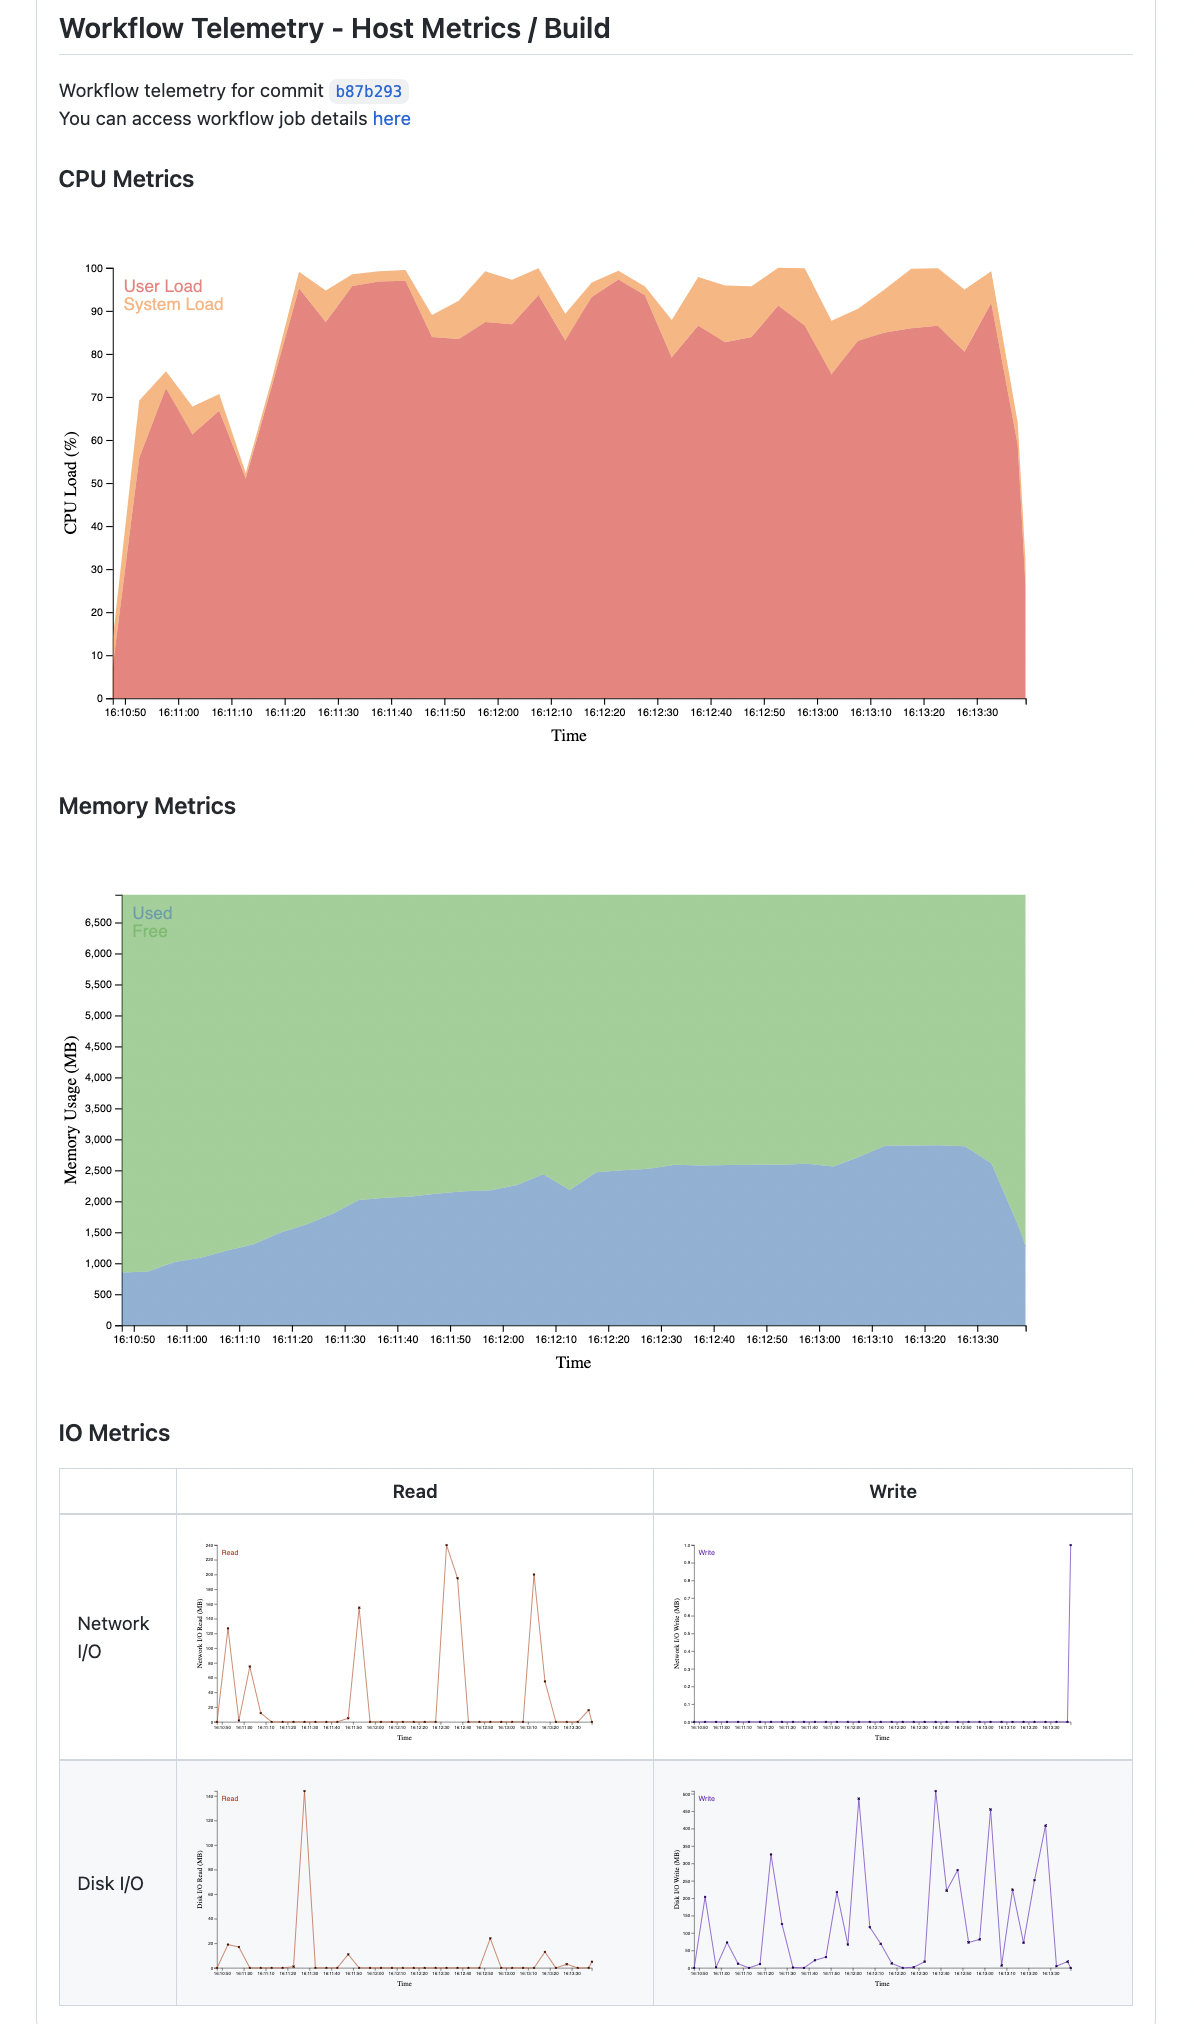
And collects the following metrics:
- CPU Load (user and system) in percentage
- Memory usage (used and free) in MB
- Network I/O (read and write) in MB
- Disk I/O (read and write) in MB
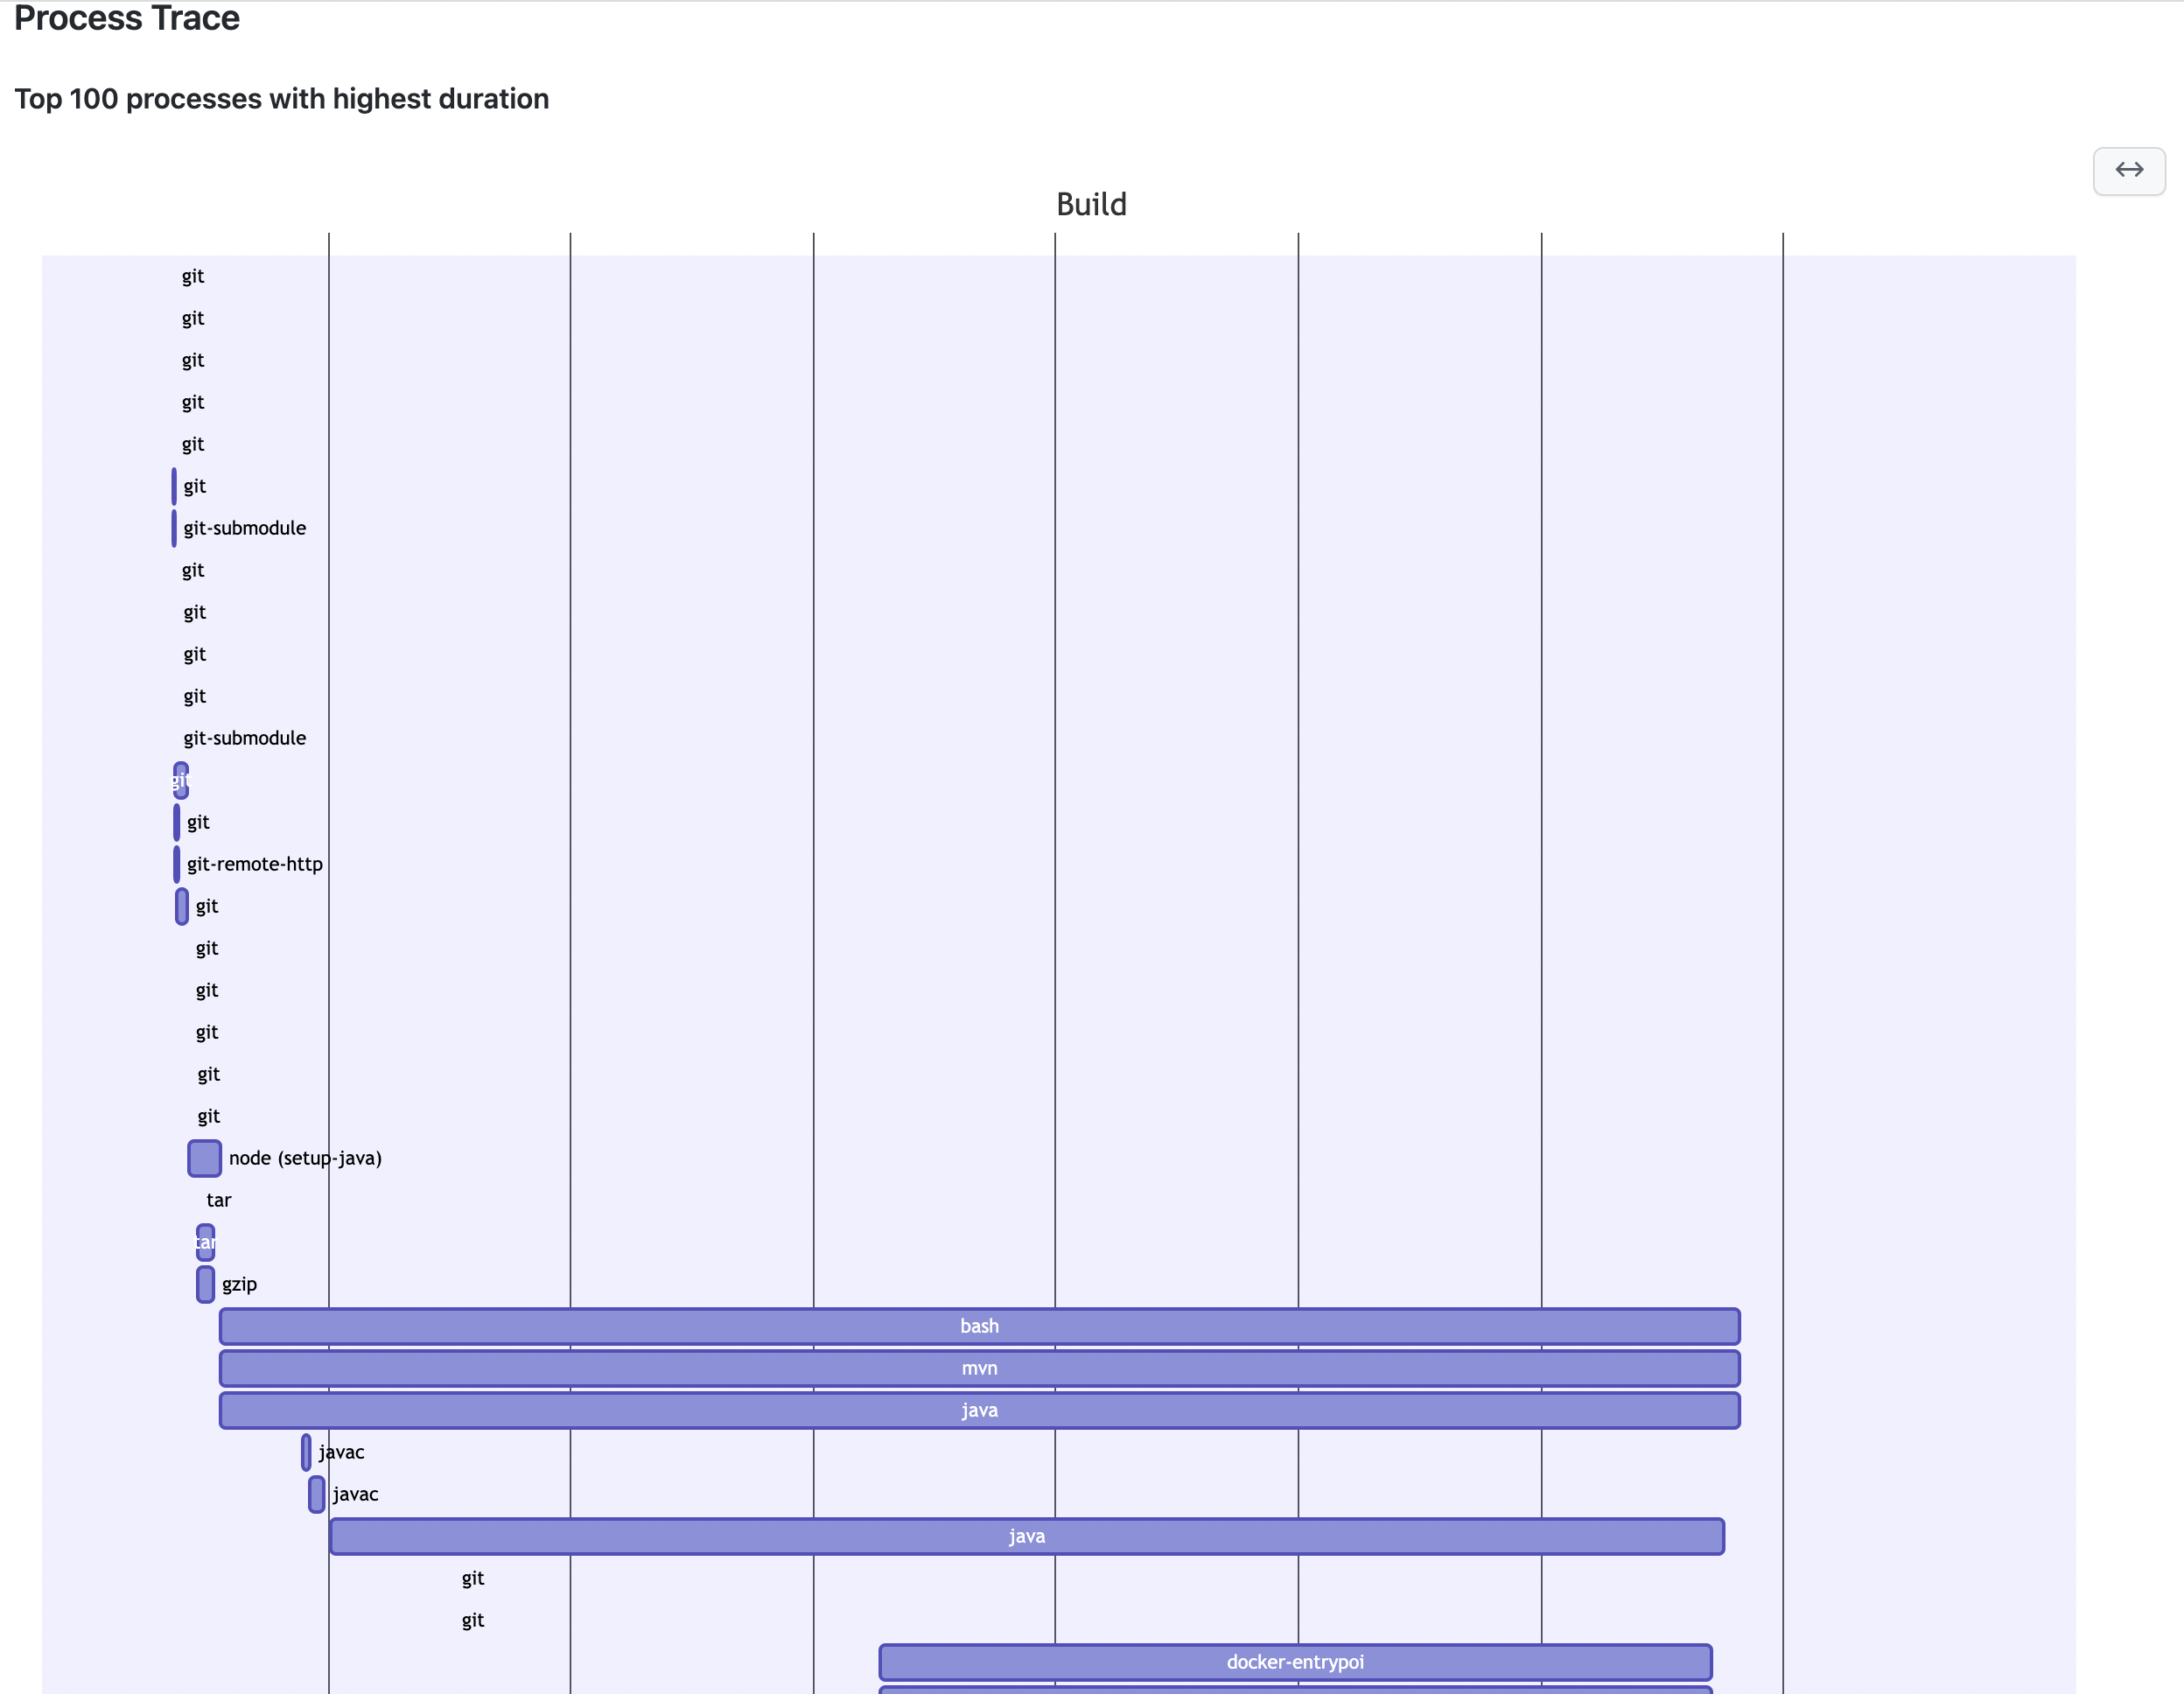
And traces the process executions (only supported on Ubuntu)
as trace chart with the following information:
- Name
- Start time
- Duration (in ms)
- Finish time
- Exit status as success or fail (highlighted as red)
and as trace table with the following information:
- Name
- Id
- Parent id
- User id
- Start time
- Duration (in ms)
- Exit code
- File name
- Arguments
An example output of a simple workflow run will look like this.
To use the action, add the following step before the steps you want to track.
permissions:
  pull-requests: write
  actions: read
jobs:
  workflow-telemetry-action:
    runs-on: ubuntu-latest
    steps:
      - name: Collect Workflow Telemetry
uses: hbfs-cloud/workflow-telemetry-action@master| Option | Requirement | Description |
|---|---|---|
github_token |
Optional | An alternative GitHub token, other than the default provided by GitHub Actions runner. |
metric_frequency |
Optional | Metric collection frequency in seconds. Must be a number. Defaults to 5. |
proc_trace_min_duration |
Optional | Puts minimum limit for process execution duration to be traced. Must be a number. Defaults to -1 which means process duration filtering is not applied. |
proc_trace_sys_enable |
Optional | Enables tracing default system processes (aws, cat, sed, ...). Defaults to false. |
proc_trace_chart_show |
Optional | Enables showing traced processes in trace chart. Defaults to true. |
proc_trace_chart_max_count |
Optional | Maximum number of processes to be shown in trace chart (applicable if proc_trace_chart_show input is true). Must be a number. Defaults to 100. |
proc_trace_table_show |
Optional | Enables showing traced processes in trace table. Defaults to true. |
comment_on_pr |
Optional | Set to true to publish the results as comment to the PR (applicable if workflow run is triggered by PR). Defaults to true. Requires pull-requests: write permission |
job_summary |
Optional | Set to true to publish the results as part of the job summary page of the workflow run. Defaults to true. |
theme |
Optional | Set to dark to generate charts compatible with Github dark mode. Defaults to light. |


