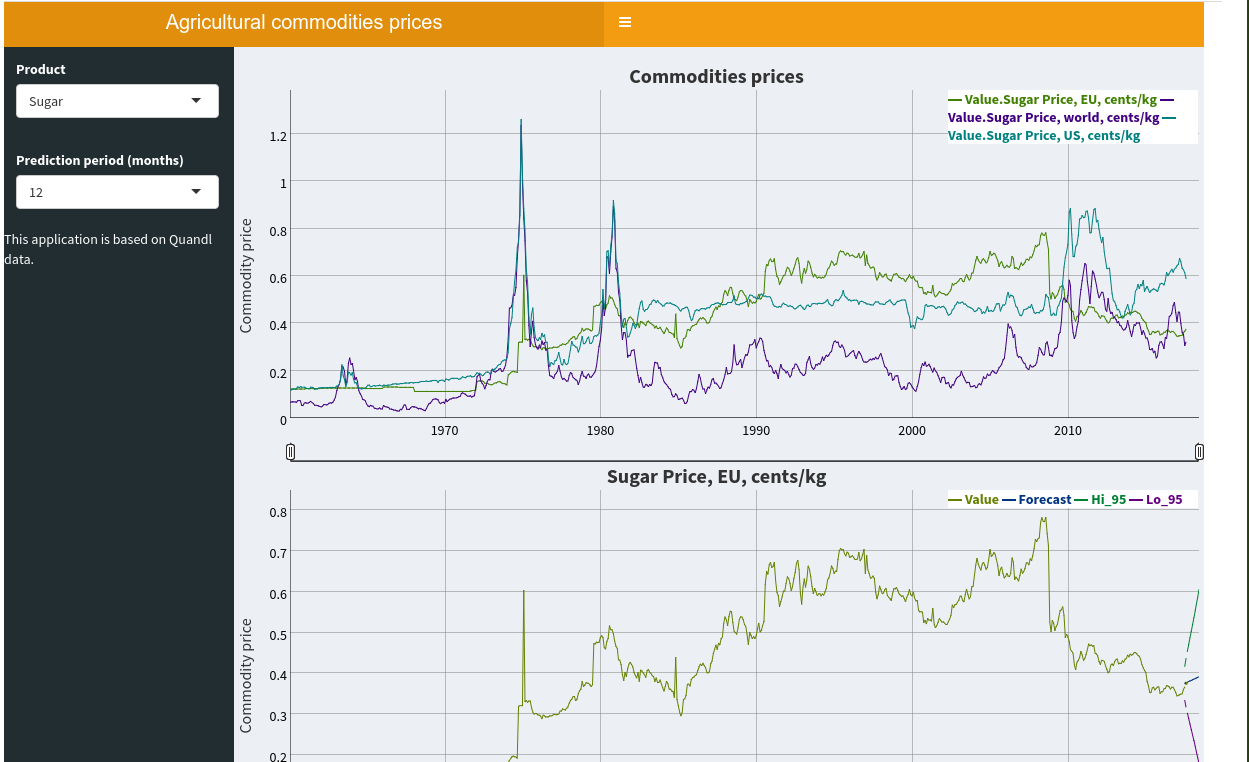
An online application, created with R+Shiny, about prices of agricultural commodities. With this application, you can monitor all agricultural commodities traded in main markets, based on data from Quandl website.

- To get the data from Quandl, you need a key to connect to its API. In this case, a public key with read-only privileges is used.
- First, install Quandl package with install.packages("Quandl").
- To draw data per commodity and market, you need to know the respective Quandl codes and then execute Quandl() function.
- Given that for every commodity, there are various datasets (per market, product subcategory etc), it was deemed useful to show them all. However, the number of datasets per commodity is not constant (there may be one dataset or five datasets per commodity), so the application must handle these cases with flexibility. A reactive object was created within which the output dygraph plots are created as many as the available datasets.
- Finally, a forecast functionality has been added, with the ability to choose prediction periods, for every commodity and in the merged dygraph plot as well.
The code is available under MIT license, as stipulated in https://github.com/iliastsergoulas/agri_prices/blob/master/LICENSE.