A Python CLI scanner to detect and plot common chart patterns
Supports Python >= 3.8 (As of v1.1.1-alpha)
If you ❤️ my work so far, please 🌟 this repo.

These were a series of pattern scanners I wrote for experimentation and fun in 2022. My inspiration was this Medium article Algorithmically Detecting (and Trading) Technical Chart Patterns with Python
See Wiki to understand how the code works: Pattern Algorithms
All patterns are detected, prior to breakout. at the last leg of the pattern. Add the stock to your watchlist and track them further.
This program does not provide any buy or sell signals. It only detects the pattern. It is upto you to decide, if a pattern is valid or tradeable.
Stock-Pattern is being constantly updated with new features and bug fixes. Run
git pullto get the latest updates.
- Clone or download the repo:
git clone https://github.com/BennyThadikaran/stock-pattern.git - Install dependencies:
pip install -r requirements.txt cdinto/srcfolder, runpy init.py. It will generate auser.jsonfile- Open
user.jsonand edit theDATA_PATHwith the folder path to your OHLC data. Files must be in CSV format in any timeframe.- If using EOD2 point it to
src/eod2_data/daily - Optionally, add a
SYM_LISTwith a file path (CSV or TXT file) containing a list of symbols to scan. (One on each line). It will serve as a default watchlist to scan. See Usage - Windows users: add an extra backslash for file paths to avoid JSON decode errors.
\\Documents\\python\\stock-pattern
- If using EOD2 point it to
- See Configuration for more options
{
  "DATA_PATH": "~/Documents/python/eod2/src/eod2_data/daily",
  "POST_SCAN_PLOT": true,
  "SYM_LIST": "./nifty_500.csv"
}Display Help: py init.py -h
Show Version: py init.py -v
py init.py (-f filepath | --sym SYM [SYM ...] | -v) options
Scan stocks using a watchlist file. Pass a file containing stocks (one on each line).
# starts an interactive prompt
py init.py -f nifty_500.csv
Scan results are stored in a json file. To plot the results, see Chart Plot options
Scan stocks from a list of symbols. Pass a list of symbols space separated.
py init.py --sym tcs astral datapattnsNOTE: If SYM_LIST is specified in user.json, -f or --sym is not required unless you wish to override the default watchlist.
Identify chart patterns on a specific date.:
# iso date format YYYY-MM-DD
py init.py -f nifty_500.csv -d 2023-01-01
Save results as images to folder
# default folder is src/images
py init.py -f nifty_500.csv --save
# add a custom folder
py init.py -f nifty_500.csv --save ~/Desktop/pattern/To skip the interactive prompt, specify a pattern string:
# Bullish VCP
py init.py -f nifty_500.csv -p vcpu
Pattern string can be one of:
| Pattern String | Description |
|---|---|
| all | All patterns |
| bull | All Bullish patterns |
| bear | All Bearish patterns |
| vcpu | VCP Up (Bullish) |
| vcpd | VCP Down (Bearish) |
| dbot | Double Bottom |
| dtop | Double Top |
| hnsu | Head & Shoulder Up (Bullish) |
| hnsd | Head & Shoulder Down (Bearish) |
| trng | Triangles (Symmetric, Ascending, Descending) |
There are other CLI options available for those wanting to tinker.
When patterns are detected the results are saved as json files. Filename is same as pattern string, for Ex. vcpu.json
To plot results of scan, use --plot.
py init.py --plot vcpu.jsonTo jump to a particular count in the result, use --idx
py init.py --plot vcpu.json --idx 15When scanning using a watchlist file, all patterns are tracked in json files stored in src/state folder. Files format is <watchlist_name>_<pattern_name>.json for ex. nifty_500_vcpu.json.
Only newly detected patterns are notified and plotted on charts.
To see all currently active patterns in market, use the --plot passing the json file from state folder
py init.py --plot state/nifty_500_vcpu.json| Key | Description |
|---|---|
| n | Next Chart |
| p | Previous Chart |
| NUM_KEY + j | Type the number followed by j to jump to index. Press ESC to clear |
user.json is used for configuration and is auto-generated on first run.
Both absolute and relative file path are supported. Tilde or ~ for home directory symbol is also supported.
| Parameter | Description |
|---|---|
| DATA_PATH | Required. Folder path for OHLC csv data. |
| SYM_LIST | Optional. File path containing list of symbols, one per line. Override with -f or --file |
| SAVE_FOLDER | Optional. Folder path to save charts as images. Override with --save |
| POST_SCAN_PLOT | Default False. If True, plots the results on the chart after a scan. |
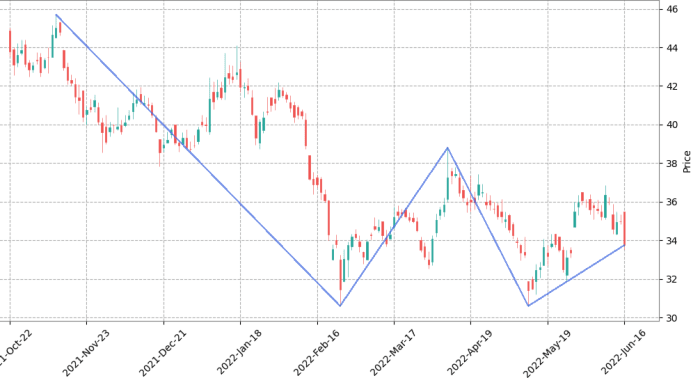
HUDCO - Double Bottom 16th June 2022
GRAPHITE - Bear VCP 18th Oct 2022
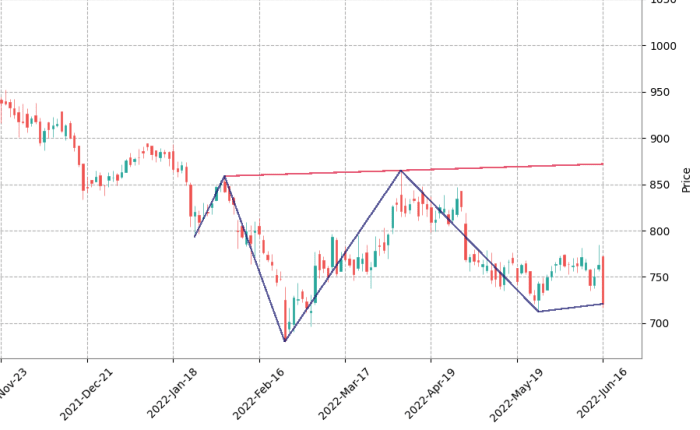
MGL - Reverse Head & Shoulder 16th June 2022
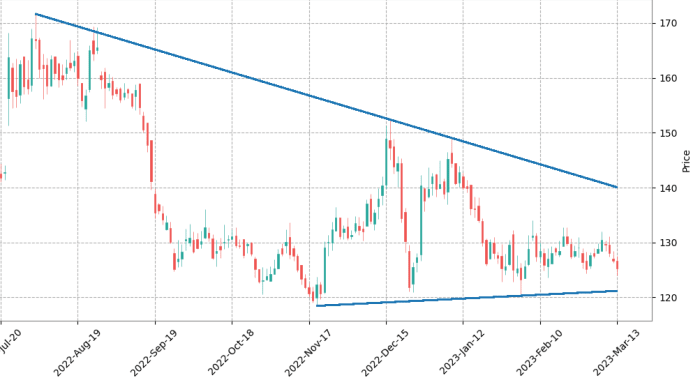
GSFC - Triangle 13th March 2023
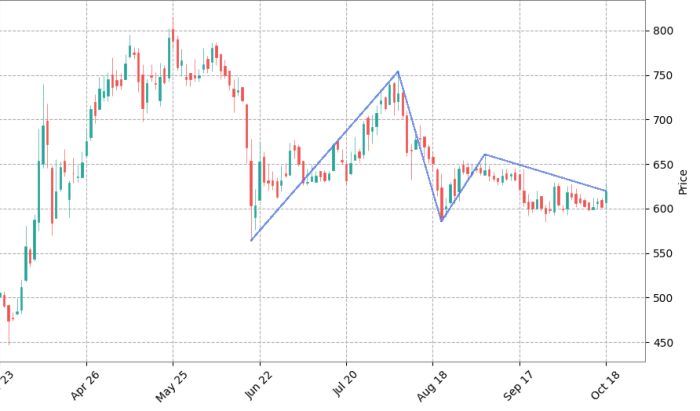
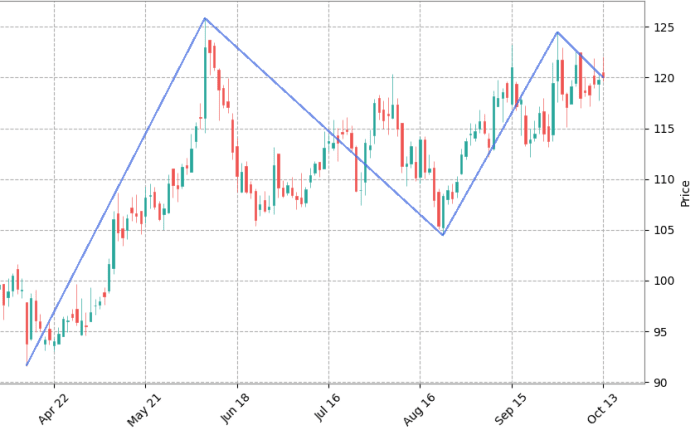
RECLTD - Double Tops 13th Oct 2021
- Make package available via pip [Delayed].
This program identifies common chart patterns and does it reasonably well (IMHO).
Stock-Pattern is not aimed at replacing a trader's trained eye. It is merely an assistance and learning tool.
CLI options available, for you to backtest the patterns. If you intend to trade these patterns, study them well and trade at your own risk.