v2.20 faster and customizable plan visualization
2.20.0 - New and customizable Plan Visualization
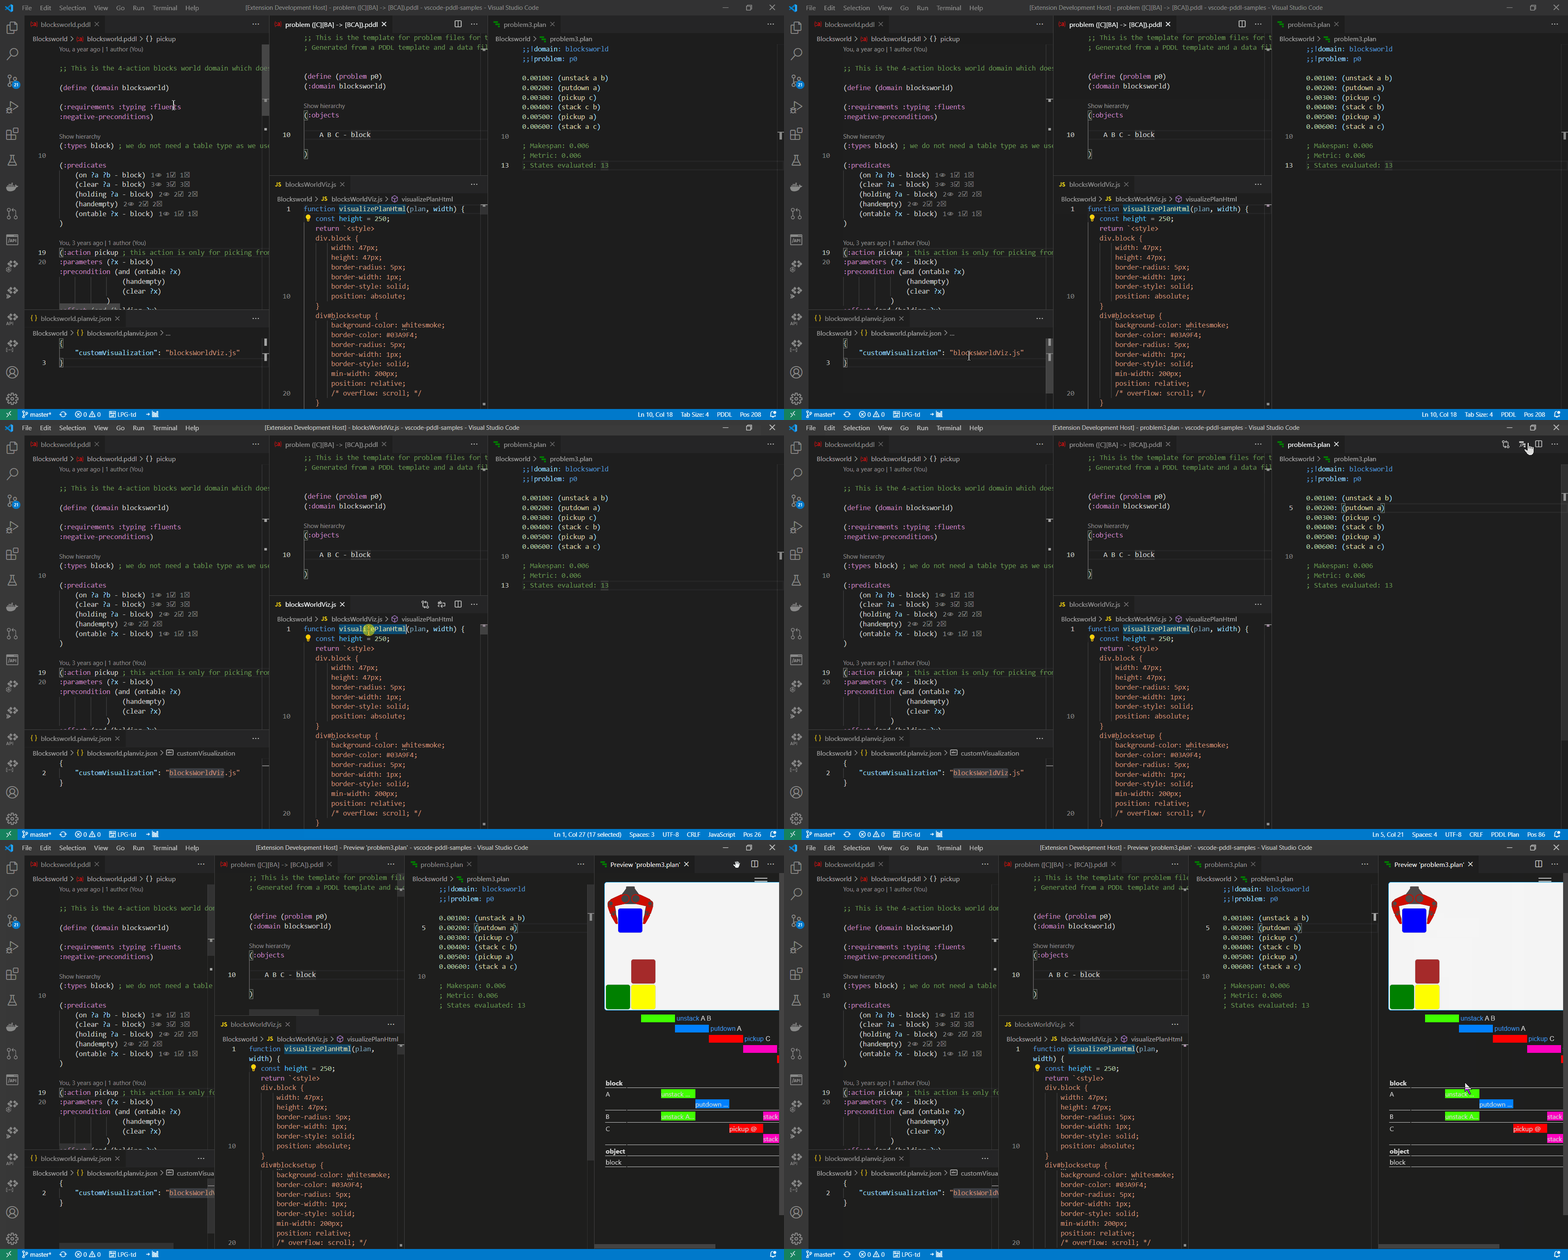
New faster plan visualization component with custom domain-specific plan visualization
The plan visualization component was extracted to a separate NPM package pddl-gantt.
This has two drivers:
- ability to replace the plan visualization in this extension
- ability to use this plan visualization as a plugin to editor.planning.domains
- faster search debugger view, which now hosts the same component
The new version is also going to display the plan faster.
What made the old one slow was the upfront evaluation of the line plots.
Now the line plots are evaluated lazily - only when they are scrolled into the view.
To study the files used in the above example, see blocksworld.planviz.json and blocksWorldViz.js.
To see all the options for plan visualization as HTML/DOM/SVG, see the function signatures here: CustomVisualization.ts.
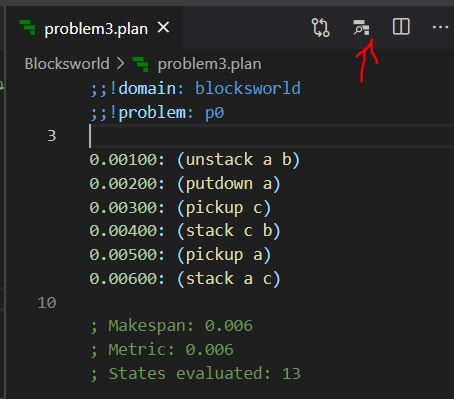
More usable plan preview and planner invocation via editor title icons
The planner invocation is now also available in the editor title context menu (by right-clicking on the editor tab of the domain/problem file).
Plan preview command is available in the editor title bar when a .plan file is focussed.
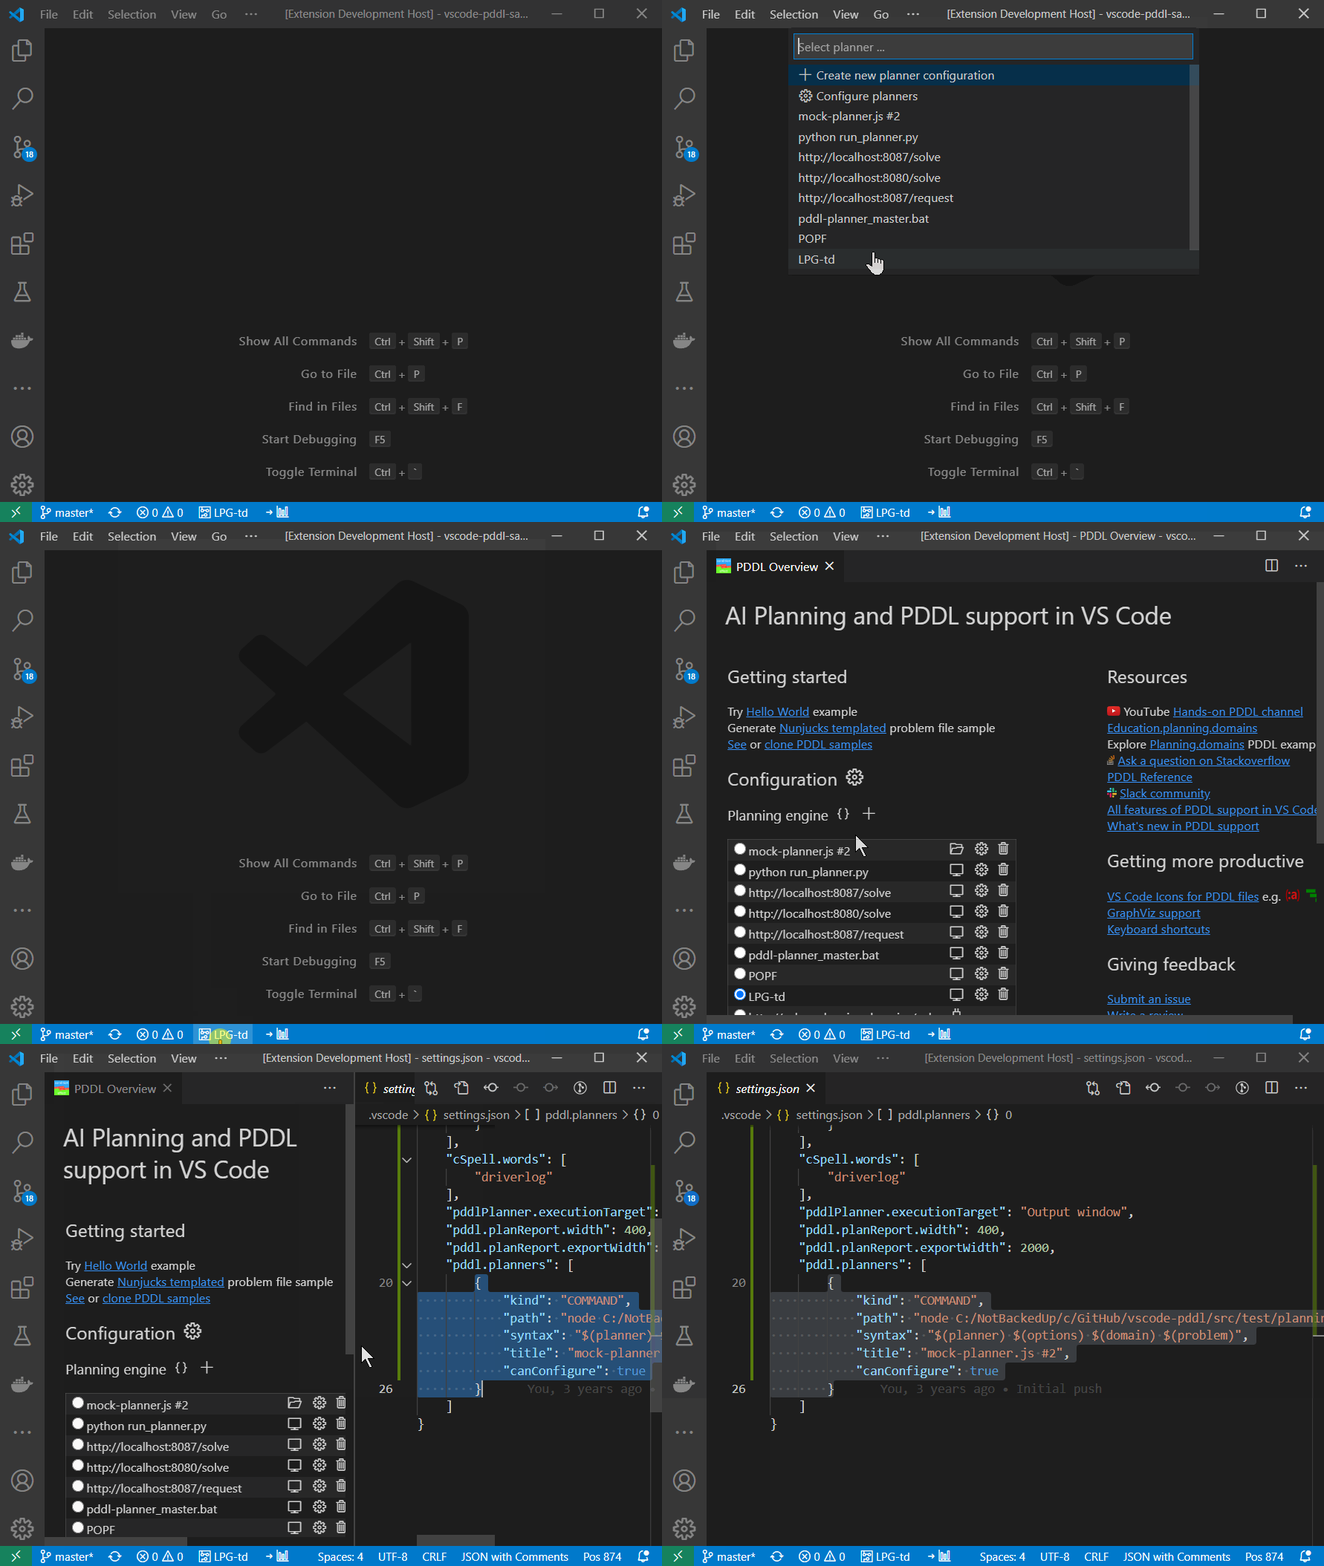
Planner configuration and addition available from planner switch drop down
While switching between planners (using the button in the status bar),
you may realize that the planner you want to switch to needs also a tweak in its configuration.
The only way to change the configuration is to go to the Overview Page (or edit it directly in the settings.json file)
but none of those choices are at hand.
It is now possible to jump to the Overview Page and configure the planner right from the drop down that lets you select a planner.
Custom domain-specific plan/state visualization
Evolved the domain-specific plan/state visualization, which can be specified using the customVisualization (originally planVisualizer) property in the <<domain>>.planviz.json config file.
Fixes
For custom planner syntax is specified (in one of the user/workspace settings.json files) the syntax validation is now more permissive.
Currently it flagged many valid planner syntaxes with a red squiggly line.
Example of syntax for LPG planner:
{
    "kind": "lpg-td",
    "canConfigure": true,
    "path": "c:\\path\\lpg-td-1.0.exe",
    "syntax": "$(planner) -o $(domain) -f $(problem) $(options)",
    "title": "LPG-td"
},
No longer attempting to display the total-time metric on the line-plot.
Engineering work
- Dependencies updated to Node 12.14.1.
- Updated to latest VAL binaries (build 55).


