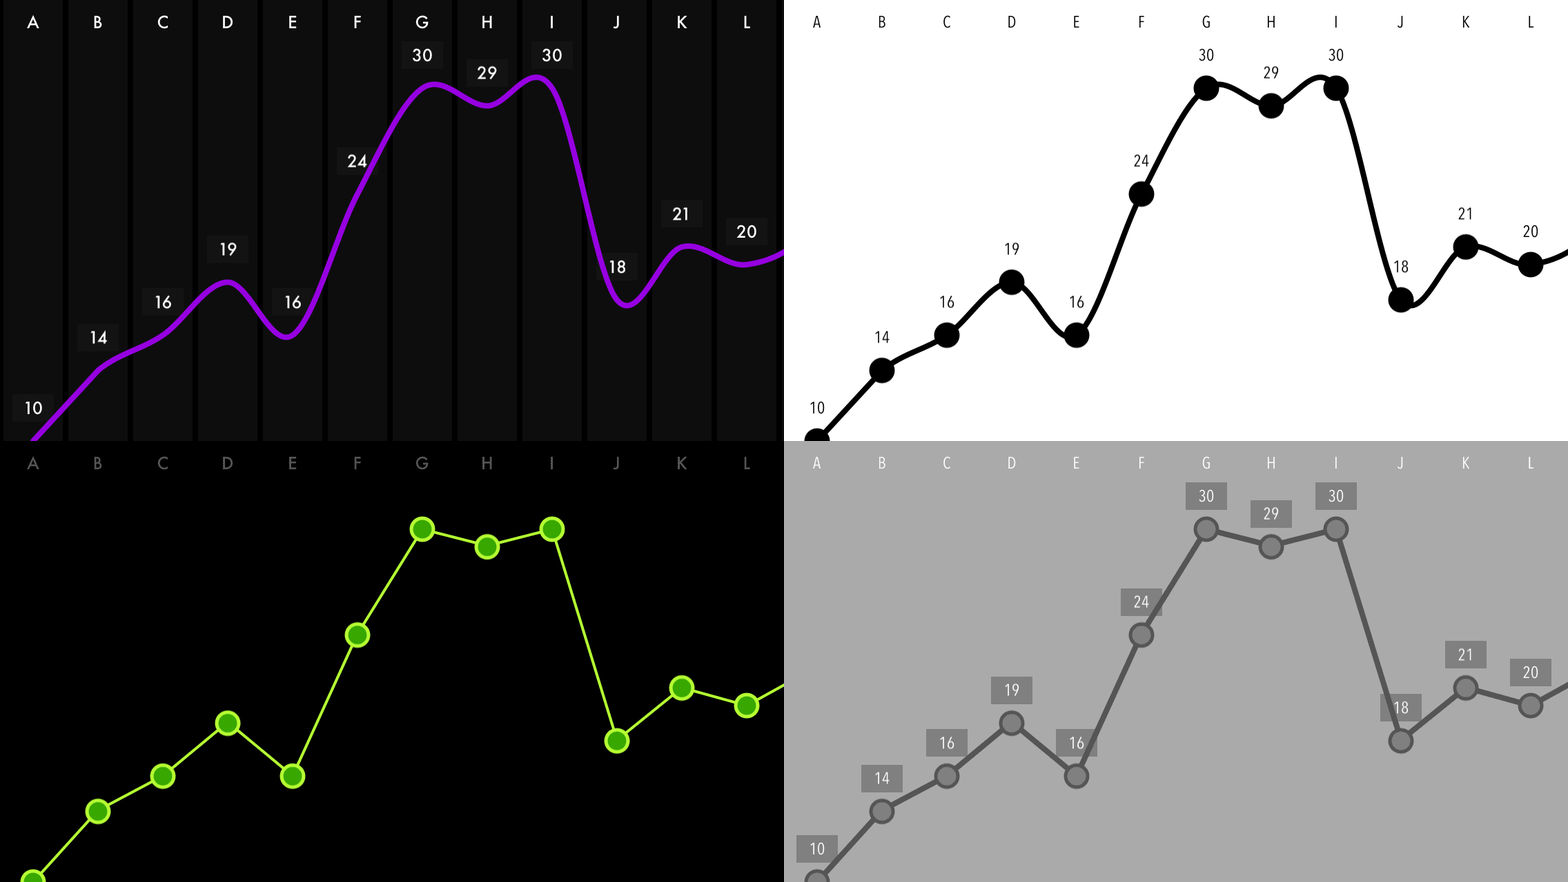
I've added a method to the class (graphImage) that can return a snapshot of the graph (as a UIImage) which can be used on the Apple Watch. You'll need to make some adjustments to the font size and stroke width but it's fun to experiment! Take a look at the sample app for examples.
Typical usage:
 JYGraphView *graph = [[JYGraphView alloc] initWithFrame:rect];
 graph.graphData = data;
 graph.strokeColor = [UIColor orangeColor];
 graph.hidePoints = YES;
 graph.hideLabels = YES;
 graph.barColor = [UIColor clearColor];
 [graph plotGraphData];
 [interfaceGroup setBackgroundImage:[graph graphImage]];
JYGraphView is an easy way to graph data in a simple, minimalist style and is highly customisable.
JYGraphView is a slightly adapted version of the graph that appears in Tempo/Weather. JYGraphView is a sublass of UIScrollView.
You can get one on screen easily using code:
JYGraphView *graphView = [[JYGraphView alloc] initWithFrame:frame];

// Set the data for the graph
graphView.graphData = @[@2,@4,@5,@7,@8,@10,@10,@10,@12,@10,@20,@21];

// Set the xAxis labels (optional)
graphView.graphXAxisLabels = @[@"Jan",@"Feb",@"Mar",@"Apr",@"May",@"Jun",@"Jul",@"Aug",@"Sep",@"Oct",@"Nov",@"Dec"];

[self.view addSubview:graphView];
Alternatively, if you use xibs you can drop a UIView into your xib > Identity Inspector > change the class name to JYGraphView.
If you don't set any of the colours, fonts, etc, the graph will be displayed in its default style (same as Tempo/Weather).
The default content width of the graphView is twice the width of the frame. You can set your own width to either narrower or wider values simply by setting graphWidth before calling .
NB The graph gets drawn on UIView's didMoveToSuperview, but in case you need to manually refresh the graph (if new data comes in) you can call it using plotGraphData like so:
graphView.graphData = newDataArray;

[graphView plotGraphData];Drag the following files into your project:
- JYGraphView.h
- JYGraphView.m
- JYGraphPoint.h
- JYGraphPoint.m
By default the graph uses a UIView subclass (JYGraphPoint) to draw each point.
NB. I highly recommend you download the sample project and run it on a device or in the simulator to play around with the customisation options (it looks better on iPad).
If you wish to customise the look of the graph a bit, you can set the strokeColor and fillColor with any UIColor before you present the graph.
graphView.pointFillColor = [UIColor colorWithRed:0.21 green:0.00f blue:0.40 alpha:1.0];
graphView.strokeColor = [UIColor colorWithRed:0.53 green:0.00 blue:0.98 alpha:1.0];
You can further customise the graphView by setting the following before calling plotGraphData:
backgroundColor, barColor, labelFont, labelFontColor, labelBackgroundColor, strokeWidth, hidePoints, useCurvedLine and hideLabels.
You can opt to hide the lines, points or labels setting their respective properties to NO.
You can opt for the curved line that uses the Catmull-Rom spline by setting useCurvedLine to YES. Default is NO.
So a fully customised graph might look something like this:
// Customisation options
graphView.fillColor = [UIColor colorWithRed:0.94 green:0.32 blue:0.59 alpha:1.0];
graphView.strokeColor = [UIColor darkGrayColor];
graphView.useCurvedLine = YES;
graphView.graphWidth = 720;
graphView.backgroundColor = [UIColor grayColor];
graphView.barColor = [UIColor lightGrayColor];
graphView.labelFont = [UIFont fontWithName:@"AvenieNextCondensed-Regular" size:12];
graphView.labelFontColor = [UIColor whiteColor];
graphView.labelBackgroundColor = [UIColor grayColor];
Some examples of customised graphs:
The graph takes your numbers, works out the range, translates them into coordinates, then draws the elements:
- background bar (which is actually a label)
- the line joining the points
- the label above each point
- and finally, the points
- Use the motion chip on the iPhone to show step counter data for the last 7/10/30 days
- Link it to your app sales and show the trend for the last 30 days/12 months
- Use it in your weather app to show predicted temperature for the next 24 hours/7 days
- No tests. I know. I'm a bad programmer.
First of all I would be thrilled if someone used this in their project and let me know about it. Secondly, I would be equally thrilled if someone gets in touch with ways in which to improve JYGraphView.
You can email me ([email protected]) or get in touch on Twitter @johnyorke
MIT License (enclosed in project folder). So in other words...fill ya' boots!


