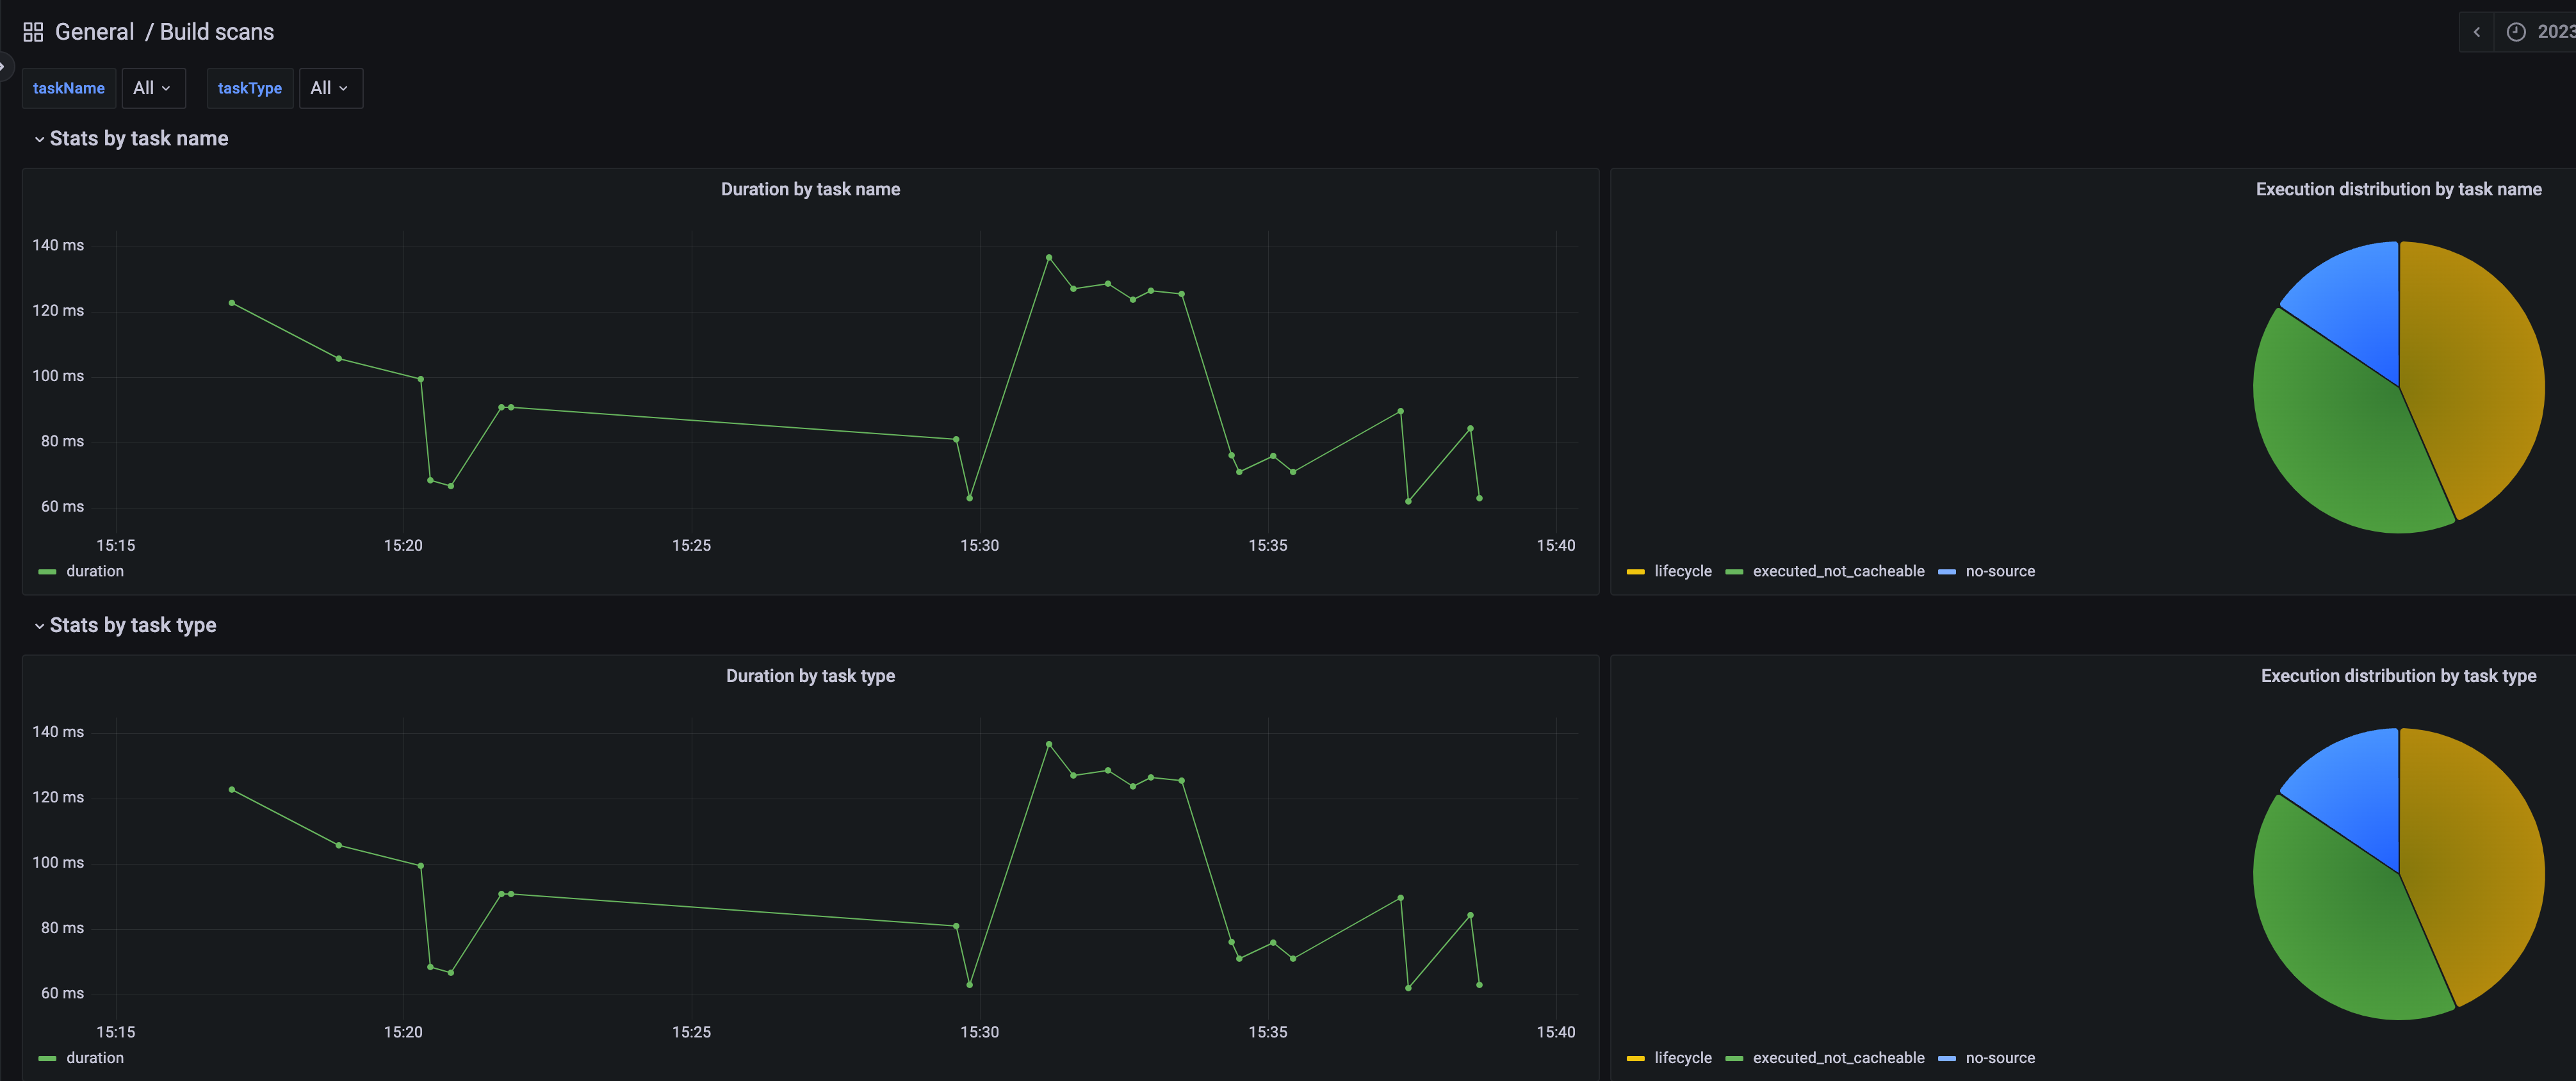
Grafana / InfluxDB based solution to display cross build statistics on Gradle tasks / Maven goals. Build information are fetched from Gradle Enterprise API (a running Gradle Enterprise instance is therefore required).
The API is not meant to be consumed at a large scale and build scans should be filtered accurately. In order to do so, the request to fetch the build scans is parameterized:
query: builds matching the advanced query only will be fetched (up to 1000 builds maximum)
Check the documentation for more details.
In the background, docker-compose is used to orchestrate the different components. A third container (runner) is additionally spawned to ease the data population / deletion process.
- Initialize the system:
> docker-compose up -d- Populate data into the system:
> GRADLE_ENTERPRISE_URL=https://gradle-enterprise.com
> GRADLE_ENTERPRISE_TOKEN=my-secret-token
# Unix timestamp in ms
> QUERY="buildStartTime > -1d and project:common-custom-user-data-gradle-plugin"
> docker exec runner /home/runner/collect-data.sh ${GRADLE_ENTERPRISE_URL} ${GRADLE_ENTERPRISE_TOKEN} ${QUERY}- Delete all data from the system (delete InfluxDB bucket):
> docker exec runner /home/runner/delete-data.shopen the Grafana dashboard on http://localhost:3000/
