Dockbix XXL is a Dockerized Zabbix preconfigured for easy Docker monitoring. This Docker image contains standard Zabbix + additional XXL community extensions. Routine tasks are included: auto-import of Zabbix DB, auto-import of Docker monitoring templates, autoregistration rule for Dockbix agent XXL, ...
If you like or use this project, please provide feedback to the author - Star it ★ or star upstream projects ★.
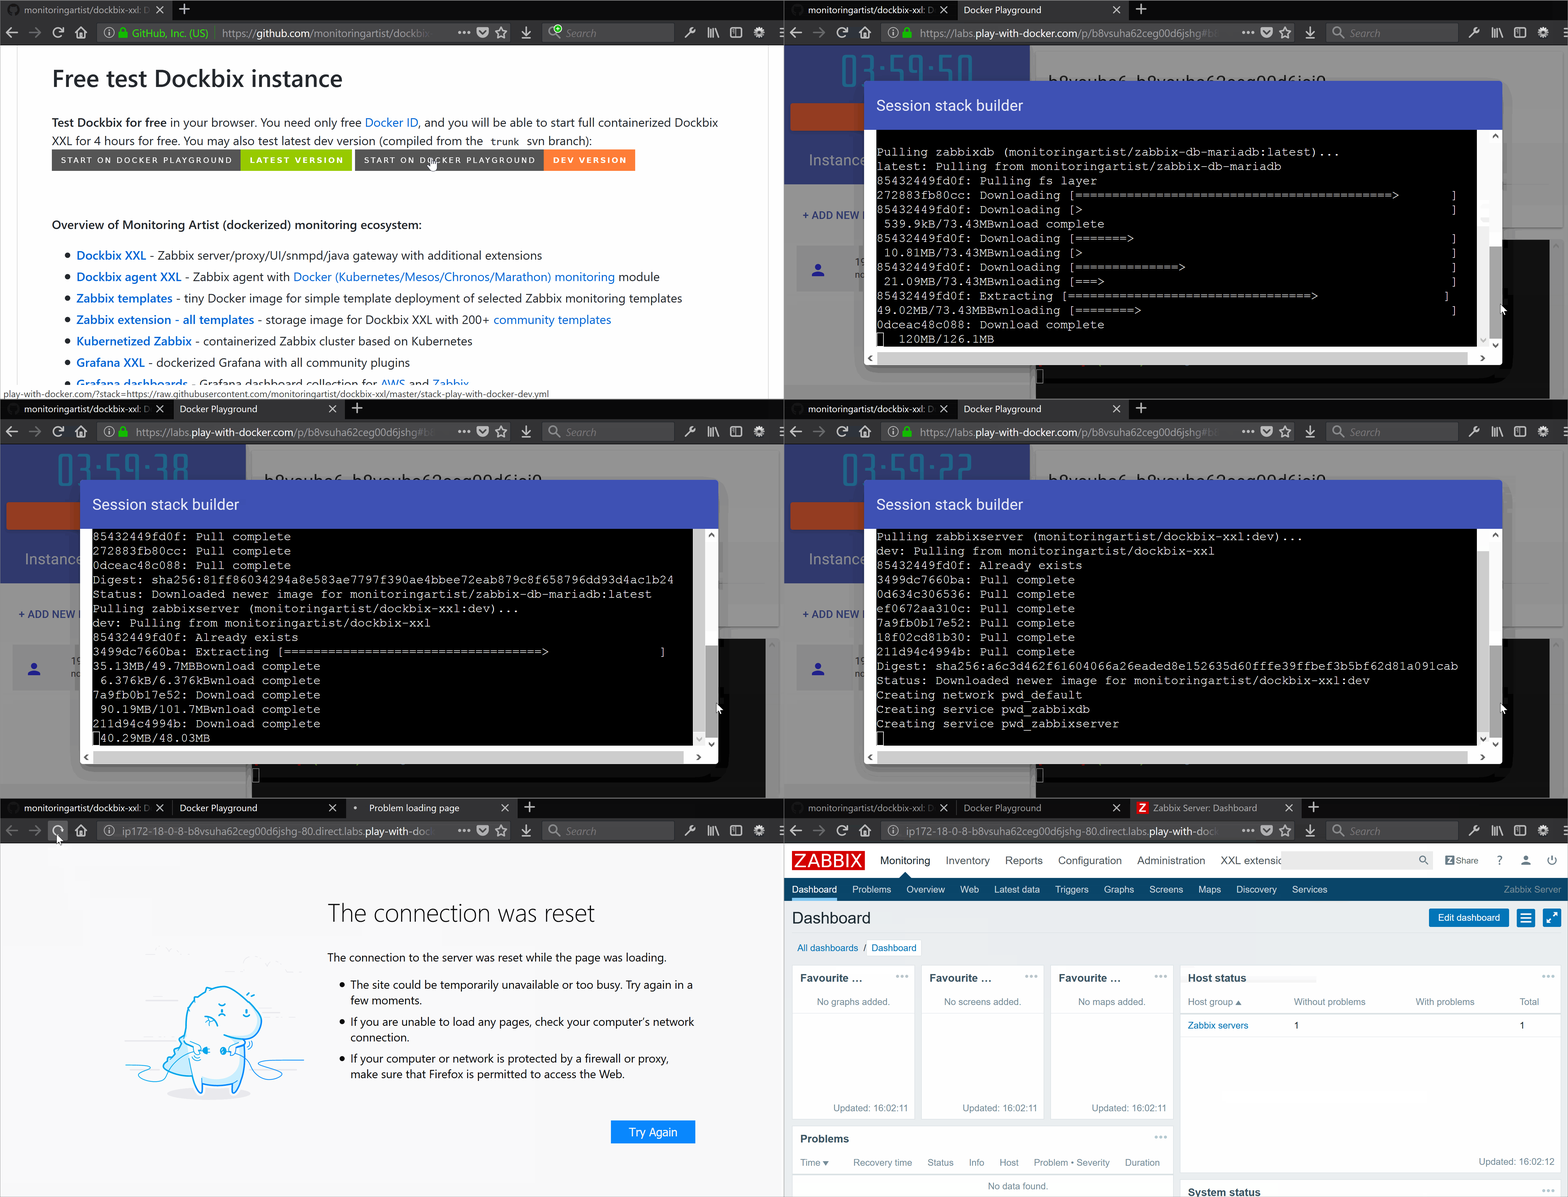
Test Dockbix for free in your browser. You need only free Docker ID, and you will
be able to start full containerized Dockbix XXL for 4 hours for free. You may also test latest dev version (compiled from the trunk svn branch):

Overview of Monitoring Artist (dockerized) monitoring ecosystem:
- Dockbix XXL - Zabbix server/proxy/UI/snmpd/java gateway with additional extensions
- Dockbix agent XXL - Zabbix agent with Docker (Kubernetes/Mesos/Chronos/Marathon) monitoring module
- Zabbix templates - tiny Docker image for simple template deployment of selected Zabbix monitoring templates
- Zabbix extension - all templates - storage image for Dockbix XXL with 200+ community templates
- Kubernetized Zabbix - containerized Zabbix cluster based on Kubernetes
- Grafana XXL - dockerized Grafana with all community plugins
- Grafana dashboards - Grafana dashboard collection for AWS and Zabbix
- Monitoring Analytics - graphic analytic tool for Zabbix data from data scientists
- Docker killer - Docker image for Docker stress and Docker orchestration testing
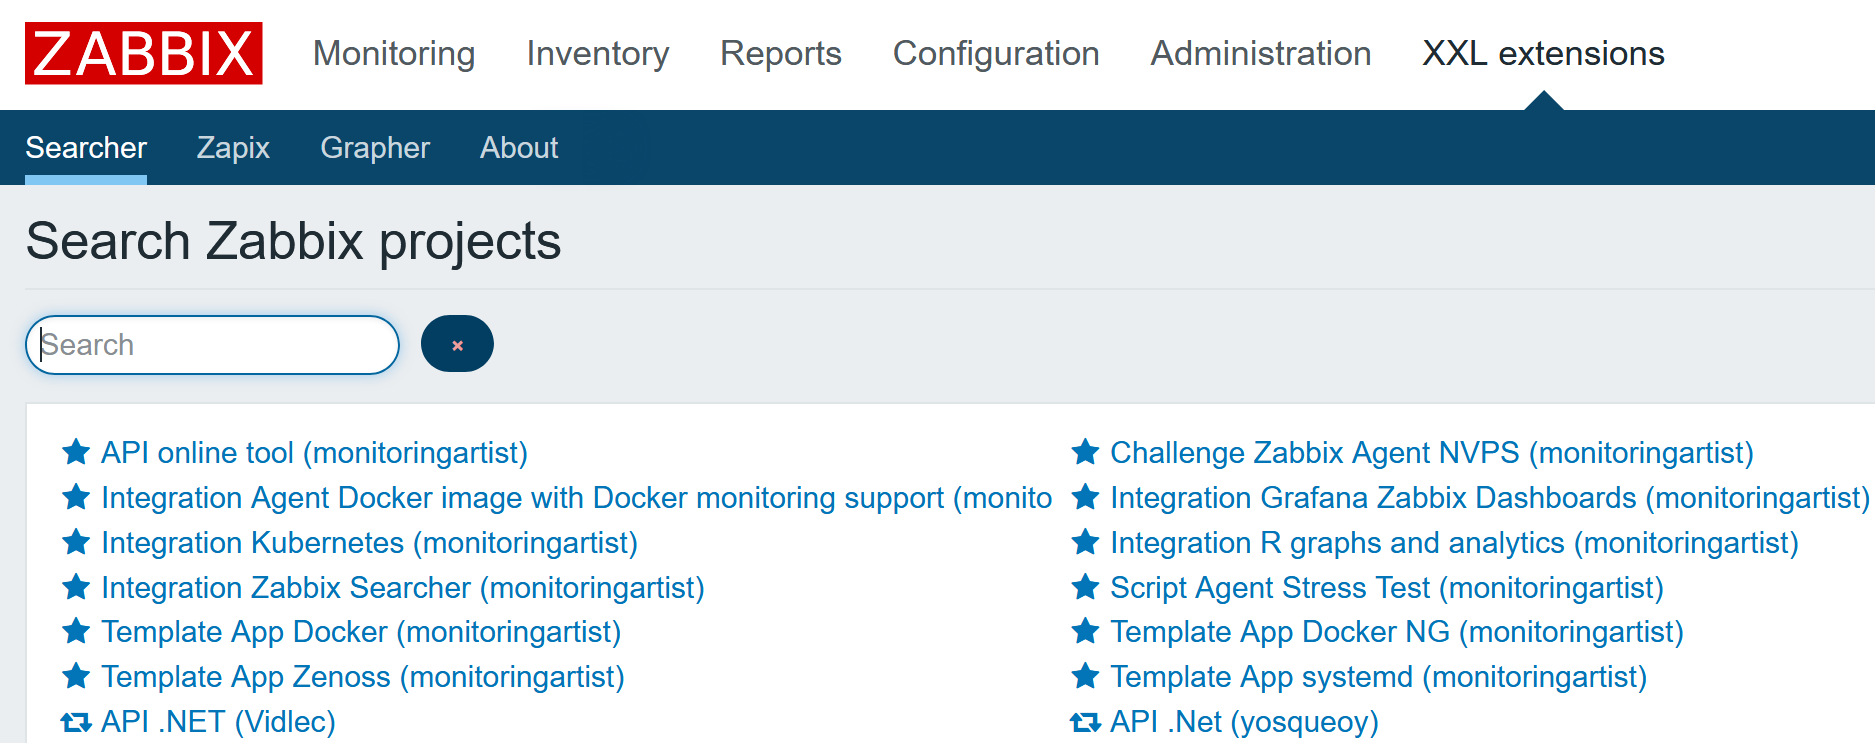
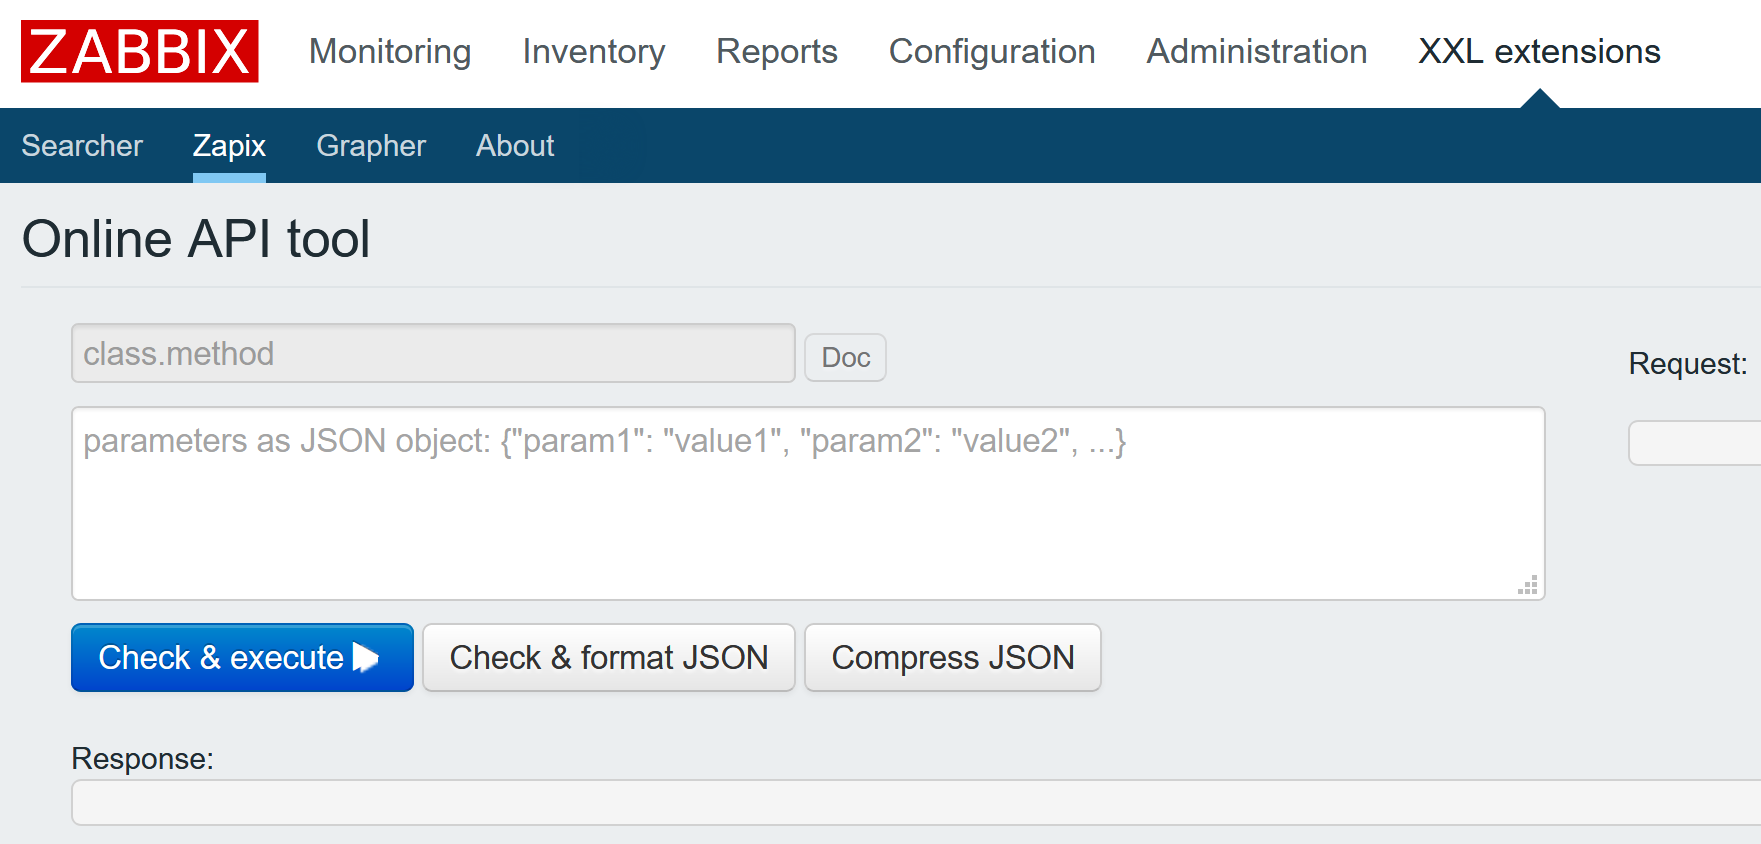
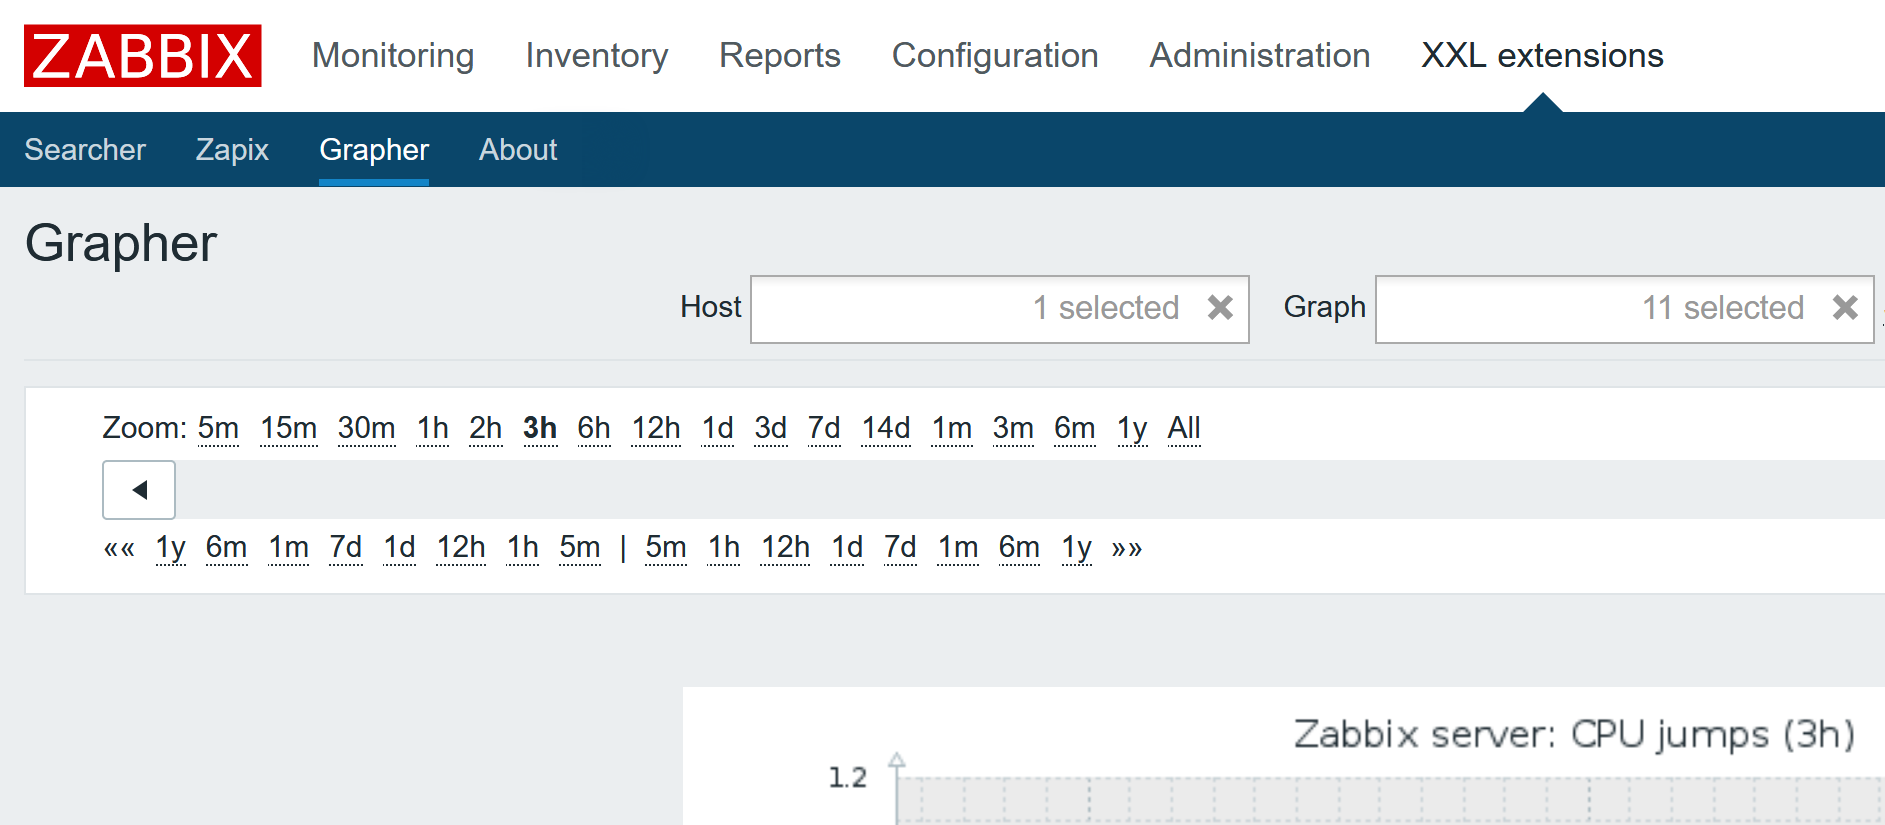
Compiled Zabbix (server, proxy, agent, java gateway, snmpd daemon) with almost all features (MySQL support, Java, SNMP, Curl, Ipmi, SSH, fping) and Zabbix web UI based on CentOS 7, Supervisor, Nginx, PHP 7. Image requires external MySQL/MariaDB database (you can run MySQL/MariaDB as a Docker container). Integrated XXL extensions: Searcher, Grapher, Zapix, template auto import, API command/script execution (some extensions must be explicitly enabled - see env variables section).
# Create data container with persistent storage in the /var/lib/mysql folder
docker run -d -v /var/lib/mysql --name dockbix-db-storage busybox:latest

# Start DB for Dockbix - default 1GB innodb_buffer_pool_size is used
docker run \
    -d \
    --name dockbix-db \
    -v /backups:/backups \
    -v /etc/localtime:/etc/localtime:ro \
    --volumes-from dockbix-db-storage \
    --env="MARIADB_USER=zabbix" \
    --env="MARIADB_PASS=my_password" \
    monitoringartist/zabbix-db-mariadb

# Start Dockbix linked to the started DB
docker run \
    -d \
    --name dockbix \
    -p 80:80 \
    -p 10051:10051 \
    -v /etc/localtime:/etc/localtime:ro \
    --link dockbix-db:dockbix.db \
    --env="ZS_DBHost=dockbix.db" \
    --env="ZS_DBUser=zabbix" \
    --env="ZS_DBPassword=my_password" \
    --env="XXL_zapix=true" \
    --env="XXL_grapher=true" \
    monitoringartist/dockbix-xxl:latest
# Wait ~30 seconds for Zabbix initialization
# Zabbix web will be available on the port 80, Zabbix server on the port 10051
# Default credentials: Admin/zabbix## Backup of DB Zabbix - configuration data only, no item history/trends
docker exec \
-ti dockbix-db \
/zabbix-backup/zabbix-mariadb-dump -u zabbix -p my_password -o /backups
## Full compressed backup of Zabbix DB
docker exec \
-ti dockbix-db \
bash -c "\
mysqldump -u zabbix -pmy_password zabbix | \
bzip2 -cq9 > /backups/zabbix_db_dump_$(date +%Y-%m-%d-%H.%M.%S).sql.bz2"
## DB data restore
# Remove Dockbix container
docker rm -f dockbix
# Restore DB data from the dump (all your current data will be dropped!!!)
docker exec -i dockbix-db sh -c 'bunzip2 -dc /backups/zabbix_db_dump_2017-28-09-02.57.46.sql.bz2 | mysql -uzabbix -p --password=my_password zabbix'
# Run Dockbix container again
docker run ...
### Start Dockbix with the Java gateway and Java pollers
docker run \
-d \
--name dockbix \
-p 80:80 \
-p 10051:10051 \
-v /etc/localtime:/etc/localtime:ro \
--link dockbix-db:dockbix.db \
--env="ZS_DBHost=dockbix.db" \
--env="ZS_DBUser=zabbix" \
--env="ZS_DBPassword=my_password" \
--env="XXL_zapix=true" \
--env="XXL_grapher=true" \
--env="ZJ_enabled=true" \
--env="ZS_StartJavaPollers=3" \
monitoringartist/dockbix-xxl:latest
## HTTPS; for more complex setup overwrite /etc/nginx/hosts.d/ssl-nginx.conf
docker run \
-d \
--name dockbix \
-p 443:443 \
-p 10051:10051 \
-v /etc/localtime:/etc/localtime:ro \
-v /<PATH_TO_SSL_CERT>/<CERT_FILE>:/etc/nginx/ssl/dummy.crt:ro \
-v /<PATH_TO_SSL_KEY>/<KEY_FILE>:/etc/nginx/ssl/dummy.key:ro \
--link dockbix-db:dockbix.db \
--env="ZS_DBHost=dockbix.db" \
--env="ZS_DBUser=zabbix" \
--env="ZS_DBPassword=my_password" \
--env="XXL_zapix=true" \
--env="XXL_grapher=true" \
monitoringartist/dockbix-xxl:latestdocker-compose up -d
To be able to connect to the database we would need one to be running first. The easiest way to do that is to use another docker image. For this purpose you can use monitoringartist/zabbix-db-mariadb image as database.
For more information about monitoringartist/zabbix-db-mariadb see README of zabbix-db-mariadb.
Example:
docker run \
	-d \
	--name dockbix-db \
	-p 3306:3306 \
	-v /etc/localtime:/etc/localtime:ro \
	--env="MARIADB_USER=zabbix" \
	--env="MARIADB_PASS=my_password" \
	monitoringartist/zabbix-db-mariadb
Remember to use the same DB credentials when deploying Dockbix image.
Available variables related to XXL features:
| Variable | Default value | Description |
|---|---|---|
| XXL_searcher | true | enable/disable integrated Zabbix searcher project |
| XXL_zapix | false | enable/disable integrated Zapix project |
| XXL_grapher | false | enable/disable integrated Grapher project |
| XXL_api | true | enable/disable auto import of templates (.xml), API curl commands (.curl) or API scripts (.sh) located in path /etc/zabbix/api/<custom_folder> |
| XXL_apiuser | Admin | username used for API commands |
| XXL_apipass | zabbix | password used for API commands |
| XXL_analytics | true | enable/disable collecting of statistics via Google Analytics |
| XXL_updatechecker | true | enable/disable check of the latest Docker image - checks are executed in the user browser once per day |
Use environment variables to config Zabbix server and Zabbix web UI (PHP). You
can add any Zabbix config variables, just add correct variable prefix
(ZS_ for Zabbix Server, ZP_ for Zabbix Proxy) and set a variable value.
Use numeric suffix (_<NUM>) for multiple config parameters.
Example: you need to increase CacheSize and load two modules for Zabbix server:
ZS_CacheSize=50M
ZS_LoadModule_1=module1.so
ZS_LoadModule_2=module2.so
If you don't specify env variable confuguration and variable is not listes in the default container variables, then default Zabbix config values are used. Default container variables:
| Variable | Default value in the container |
|---|---|
| PHP_date_timezone | UTC |
| PHP_max_execution_time | 300 |
| PHP_max_input_time | 300 |
| PHP_memory_limit | 128M |
| PHP_error_reporting | E_ALL |
| ZS_LogType | console |
| ZS_PidFile | /var/run/zabbix_server.pid |
| ZS_User | zabbix |
| ZS_DBHost | zabbix.db |
| ZS_DBName | zabbix |
| ZS_DBUser | zabbix |
| ZS_DBPassword | zabbix |
| ZS_DBPort | 3306 |
| ZS_PidFile | /tmp/zabbix_server.pid |
| ZS_AlertScriptsPath | /usr/local/share/zabbix/alertscripts |
| ZS_ExternalScripts | /usr/local/share/zabbix/externalscripts |
| ZS_SSLCertLocation | /usr/local/share/zabbix/ssl/certs |
| ZS_SSLKeyLocation | /usr/local/share/zabbix/ssl/keys |
| ZS_LoadModulePath | /usr/lib/zabbix/modules |
| ZS_JavaGateway | 127.0.0.1 |
| ZS_JavaGatewayPort | 10052 |
| ZW_ZBX_SERVER | localhost |
| ZW_ZBX_SERVER_PORT | 10051 |
| ZW_ZBX_SERVER_NAME | Zabbix Server |
| ZJ_LISTEN_IP | 0.0.0.0 |
| ZJ_LISTEN_PORT | 10052 |
| ZJ_PID_FILE | /tmp/zabbix_java.pid |
| ZJ_START_POLLERS | 5 |
| ZJ_TIMEOUT | 3 |
| ZJ_LogLevel | error |
| ZJ_TCP_TIMEOUT | 3000 |
| ZP_LogType | console |
| ZP_DBHost | zabbixproxy.db |
| ZP_DBName | zabbix |
| ZP_DBUser | zabbix |
| ZP_DBPassword | zabbix |
| ZP_DBPort | 3306 |
| ZP_User | zabbix |
Note: Japanese users might want to set env variable ZBX_GRAPH_FONT_NAME=ipagp to support japanese font in graphs.
Zabbix config files can be also used. Environment configs will be overridden by values from the config files in this case. You need only to add /etc/custom-config/ volume:
-v /host/custom-config/:/etc/custom-config/
Available config file names:
| File name | Description |
|---|---|
| php-zabbix.ini | PHP configuration file |
| zabbix_server.conf | Zabbix server configuration file |
| zabbix_proxy.conf | Zabbix proxy configuration file |
| logback.xml | Zabbix Java gateway log configuration file |
Zabbix role environment variables:
| Variable | Default value in the container | Description |
|---|---|---|
| ZS_enabled | true | Enable Zabbix Server |
| ZA_enabled | true | Enable Zabbix Agent |
| ZW_enabled | true | Enable Zabbix Web UI (Nginx/PHP 7) |
| ZP_enabled | false | Enable Zabbix Proxy |
| ZJ_enabled | false | Enable Zabbix Java Gateway |
| SNMPTRAP_enabled | false | Enable SNMP trap process (port 162) |
All Zabbix server components are enabled by default except SNMP traps processing. However, some users want to run dedicated Zabbix component per container. Typical use case is Zabbix web UI. Thanks to role environment variables are users able to execute many web UI containers, which helps to scale Zabbix as a service.
If env variable XXL_api is true (default value), then bootstrap script will try to find recursively any .xml, .api, .sh in /etc/zabbix/api. For example mount folder with your XML templates and script will try to import all your templates:
-v /myhosttemplatefolder/:/etc/zabbix/api/mytemplates-
XML files: All
*.xmlfile are processed as Zabbix XML template and script tries to import them by using Zabbix API. Default additional imported templates are basic Docker templates. -
Api files: All
*.apifiles are processed as data commands for Zabbix API. Standard curl command is used for execution. Request id<ID>and auth token<AUTH_TOKEN>are replaced automatically. Example API command, which is used to enable Zabbix server host:
{"jsonrpc":"2.0","method":"host.update","id":<ID>,"auth":"<AUTH_TOKEN>","params":{"hostid":"10084","status":0}}-
Sh files: All
*.sh*files are processed as scripts and they are intended for user custom API scripting. Env variablesXXL_apiuser, XXL_apipassshould be used for API authentication. -
SQL files: All
*.sql*files are processed as SQL commands on Zabbix DB. It's useful for features, which are not available through Zabbix API, such as regular expression definition, etc.
Example: set up nginx - customize default.conf
and then use volume to mount custom nginx configuration (for example -v /etc/https-zabbix-nginx.conf:/etc/nginx/hosts.d/default.conf) + mount also certificates used in your custom nginx conf file.
Use docker command to see if all required containers are up and running:
$ docker ps
Check logs of Dockbix container:
$ docker logs dockbixSometimes you might just want to review how things are deployed inside a running container, you can do this by executing a bash shell through docker's exec command:
docker exec -ti zabbix /bin/bashRun specific Zabbix version, e.g. 3.4.0 - just specify 3.4.0 tag for image:
	docker run \
		-d \
		--name zabbix \
		-p 80:80 \
		-p 10051:10051 \
		-v /etc/localtime:/etc/localtime:ro \
		--link zabbix-db:zabbix.db \
		--env="ZS_DBHost=zabbix.db" \
		--env="ZS_DBUser=zabbix" \
		--env="ZS_DBPassword=my_password" \
monitoringartist/dockbix-xxl:3.4.0Unfortunately, this project has only MySQL support due to specific XXL SQL API feature. You can use forked repo with PostgreSQL support https://github.com/luchnck/zabbix-xxl-postgresql.
This project supports only issues related to this Docker image. Visit help or advice regarding Zabbix for problem with Zabbix configuration.
This GitHub project has been used to build previous Docker images. Use
of prior images is strongly discouraged for production use. Please migrate
them to the Docker image monitoringartist/dockbix-xxl. Don't forget to backup
your DB data before any migration.
monitoringartist/zabbix-xxl- full compatibility with the imagemonitoringartist/dockbix-xxl; migration: just change name of the used imagemonitoringartist/zabbix-server-3.0- full compatibility with the imagemonitoringartist/dockbix-xxl; migration: just change name of the used imagemonitoringartist/zabbix-2.4- not compatible with the imagemonitoringartist/dockbix-xxl; migration: read readme and create new container config
Devops Monitoring Expert, who loves monitoring systems and cutting/bleeding edge technologies: Docker, Kubernetes, ECS, AWS, Google GCP, Terraform, Lambda, Zabbix, Grafana, Elasticsearch, Kibana, Prometheus, Sysdig,...
Summary:
- 2000+ GitHub stars
- 10 000+ Grafana dashboard downloads
- 1 000 000+ Docker image pulls
Professional devops / monitoring / consulting services:


