Complete solution that helps store owners track the occupancy of their stores in real-time and also provides historical data for business analysis through graphs.
Group project by me, Joshua James Lewis, Ani Vladislavova Boyadzhieva and Vlad-Andrei Gruia, part of our 3rd semester courses in Programming and Technology.
The architecture of the solution can be seen on the image below:

Firstly, the data are collected by the Raspberry Pis using an add-on board called SenseHAT. When a door is opened, the accelerometer of the Sense HAT is triggered, and data are captured and broadcasted to LAN using UDP in Python. This broadcast message is captured by a .NET Core Console Application (C#) running on a PC/Server on LAN and manipulated accordingly depending on which Raspberry Pi it is coming from (the one installed on the entrance or the exit door). This Console application sends data to a Microsoft SQL Server Database hosted on an Azure SQL Server, through a .NET Core RESTful WebAPI (C#) hosted as an Azure App Service, using HTTP methods (POST and GET). The Web Application is implemented using Typescript, HTML and SCSS and request data from the Database through the WebAPI using Axios (HTTP GET). A JavaScript Library called Highcharts is used in the Web Application to represent graphically the data as charts. A 3rd party API, named Open Weather, is called inside the Web App using Axios (HTTP GET), displaying weather data in a weather widget. The app user settings are saved locally on the browser as cookies. Our WebAPI uses a 3rd party API, named Mailgun, that sends email notifications (HTTP POST) to the user notifying when the maximum allowed occupancy is reached. Lastly, the Web Application is hosted as a GitHub Page, to ensure ease of use and security.
Demo of the solution in action can be found in Youtube:
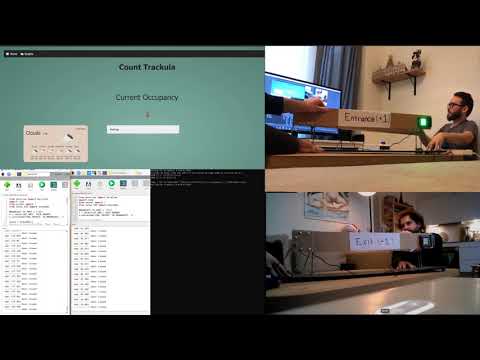
Example of Raspberry Pi with SenseHAT running the broadcastEntranceCW.py script (see below).

During first-time installation:
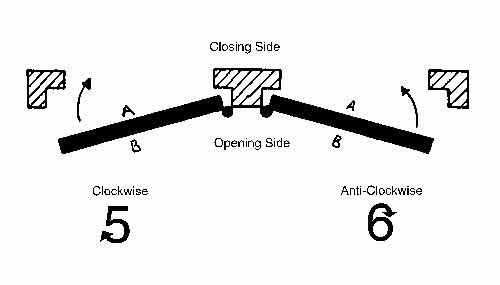
- Run broadcastEntranceCW.py after you set up the Raspberry Pi with the SenseHAT in an Entrance door that opens clockwise.
- Run broadcastEntranceCounterCW.py after you set up the Raspberry Pi with the SenseHAT in an Entrance door that opens counter-clockwise.
- Run broadcastExitCW.py after you set up the Raspberry Pi with the SenseHAT in an Exit door that opens clockwise.
- Run broadcastExitCounterCW.py after you set up the Raspberry Pi with the SenseHAT in an Exit door that opens counter-clockwise.
- Run broadcast_random.py if you want to broadcast a message containing either an Entrance or an Exit signal without the need to own a SenseHAT. This is to be used for testing purposes.
Here is an image of our a Raspberry Pi with SenseHAT on a physical prototype of a door used for testing purposes.

Console app that is to be run on client PC in the same LAN as the Raspberry Pi with SenseHAT that run CountTrackulaUDPBroadcast.
REST API of CountTrackula that receives requests from CountTrackulaWebApp and CountTrackulaClient.
Also published at Azure: https://counttrackulawebapi.azurewebsites.net/api/DoorsTracking
Web App of CountTrackula that is already published at https://counttrackula.github.io/
Installation: run command npm install and then npm run watch so that all required libraries are installed.
When the user visits the web page, he is introduced to the Main Page. In the Main Page the user is shown the "Occupancy", along with its corresponding value.
The Occupancy item displays the total amount of people that are currently inside the store. This number is of major concern for the user.
Info: The Occupancy is reset to zero every day at 00:00, a time outside the opening hours is preferred, where all the staff have ended their shifts.
In the Main Page, the user also has the option to tweak the settings of the web app. By pressing the Settings button, the page expands, and the settings section appears. This section the user is shown a list consisting of three items: the “Maximum Customers”, “Warning Range” and “Email”, along with their corresponding input fields.
-
In the Maximum Customers field, the user must enter the maximum number of people that are allowed to be inside the store at any point.
-
In the Warning Range field, the user must enter a number that illustrates the difference between the Maximum Customers and the Occupancy number, that the user wants to be warned with a notification. If e.g., the maximum Customers is 32 and the user wants to be notified that the limit is almost reached when the Occupancy reaches 27, he/she then must enter 5 as Warning Range field. This fields allows more flexibility for the users, as different types of stores have different traffic, so tweaking with this value gives the store staff enough time to close the entrance temporarily to new customers.
-
In the Email field, the user must enter an email where they will be notified. Please contact [email protected] to add your email in the Mailgun's verified recipent list, so that the email notification is actually sent.
As soon as the settings fields are filled, the user can press the Save Settings button, the settings are saved, and the Settings section is hidden automatically.
The user can also navigate through the different pages of the app using the navigation bar on the top. By pressing the Home button, the user is returned to the Main Page and by pressing the Graph button the user is introduced to the Graph Page. In the Graph Page, a representation of the occupancy through the time is displayed in an area graph and the daily customers of the last week in a histogram. The data that are represented here are collected throughout all the days of use of the device, including the current day. The histogram is dynamic as the horizontal time axis range can be changed with the use of the buttons on the bottom of the page. The available options for time ranges of the Area graph are: Day, Week, Month and All.