By: @Milagros Bernardi (UMA - VI MÁSTER PROPIO UNIVERSITARIO EN ADVANCED ANALYTICS ON BIG DATA (2021-23))
- clone the repository by performing the command:
git clone https://github.com/mililic85/DataVisualization- run the code in shell to install the dependencies:
npm install- start npm by performing the command:
npm start- go to a web explorer and type:
localhost:1234
- The webpage is displayed. To change the data displayed, clik in the buttons. First data displayed is the "old data".
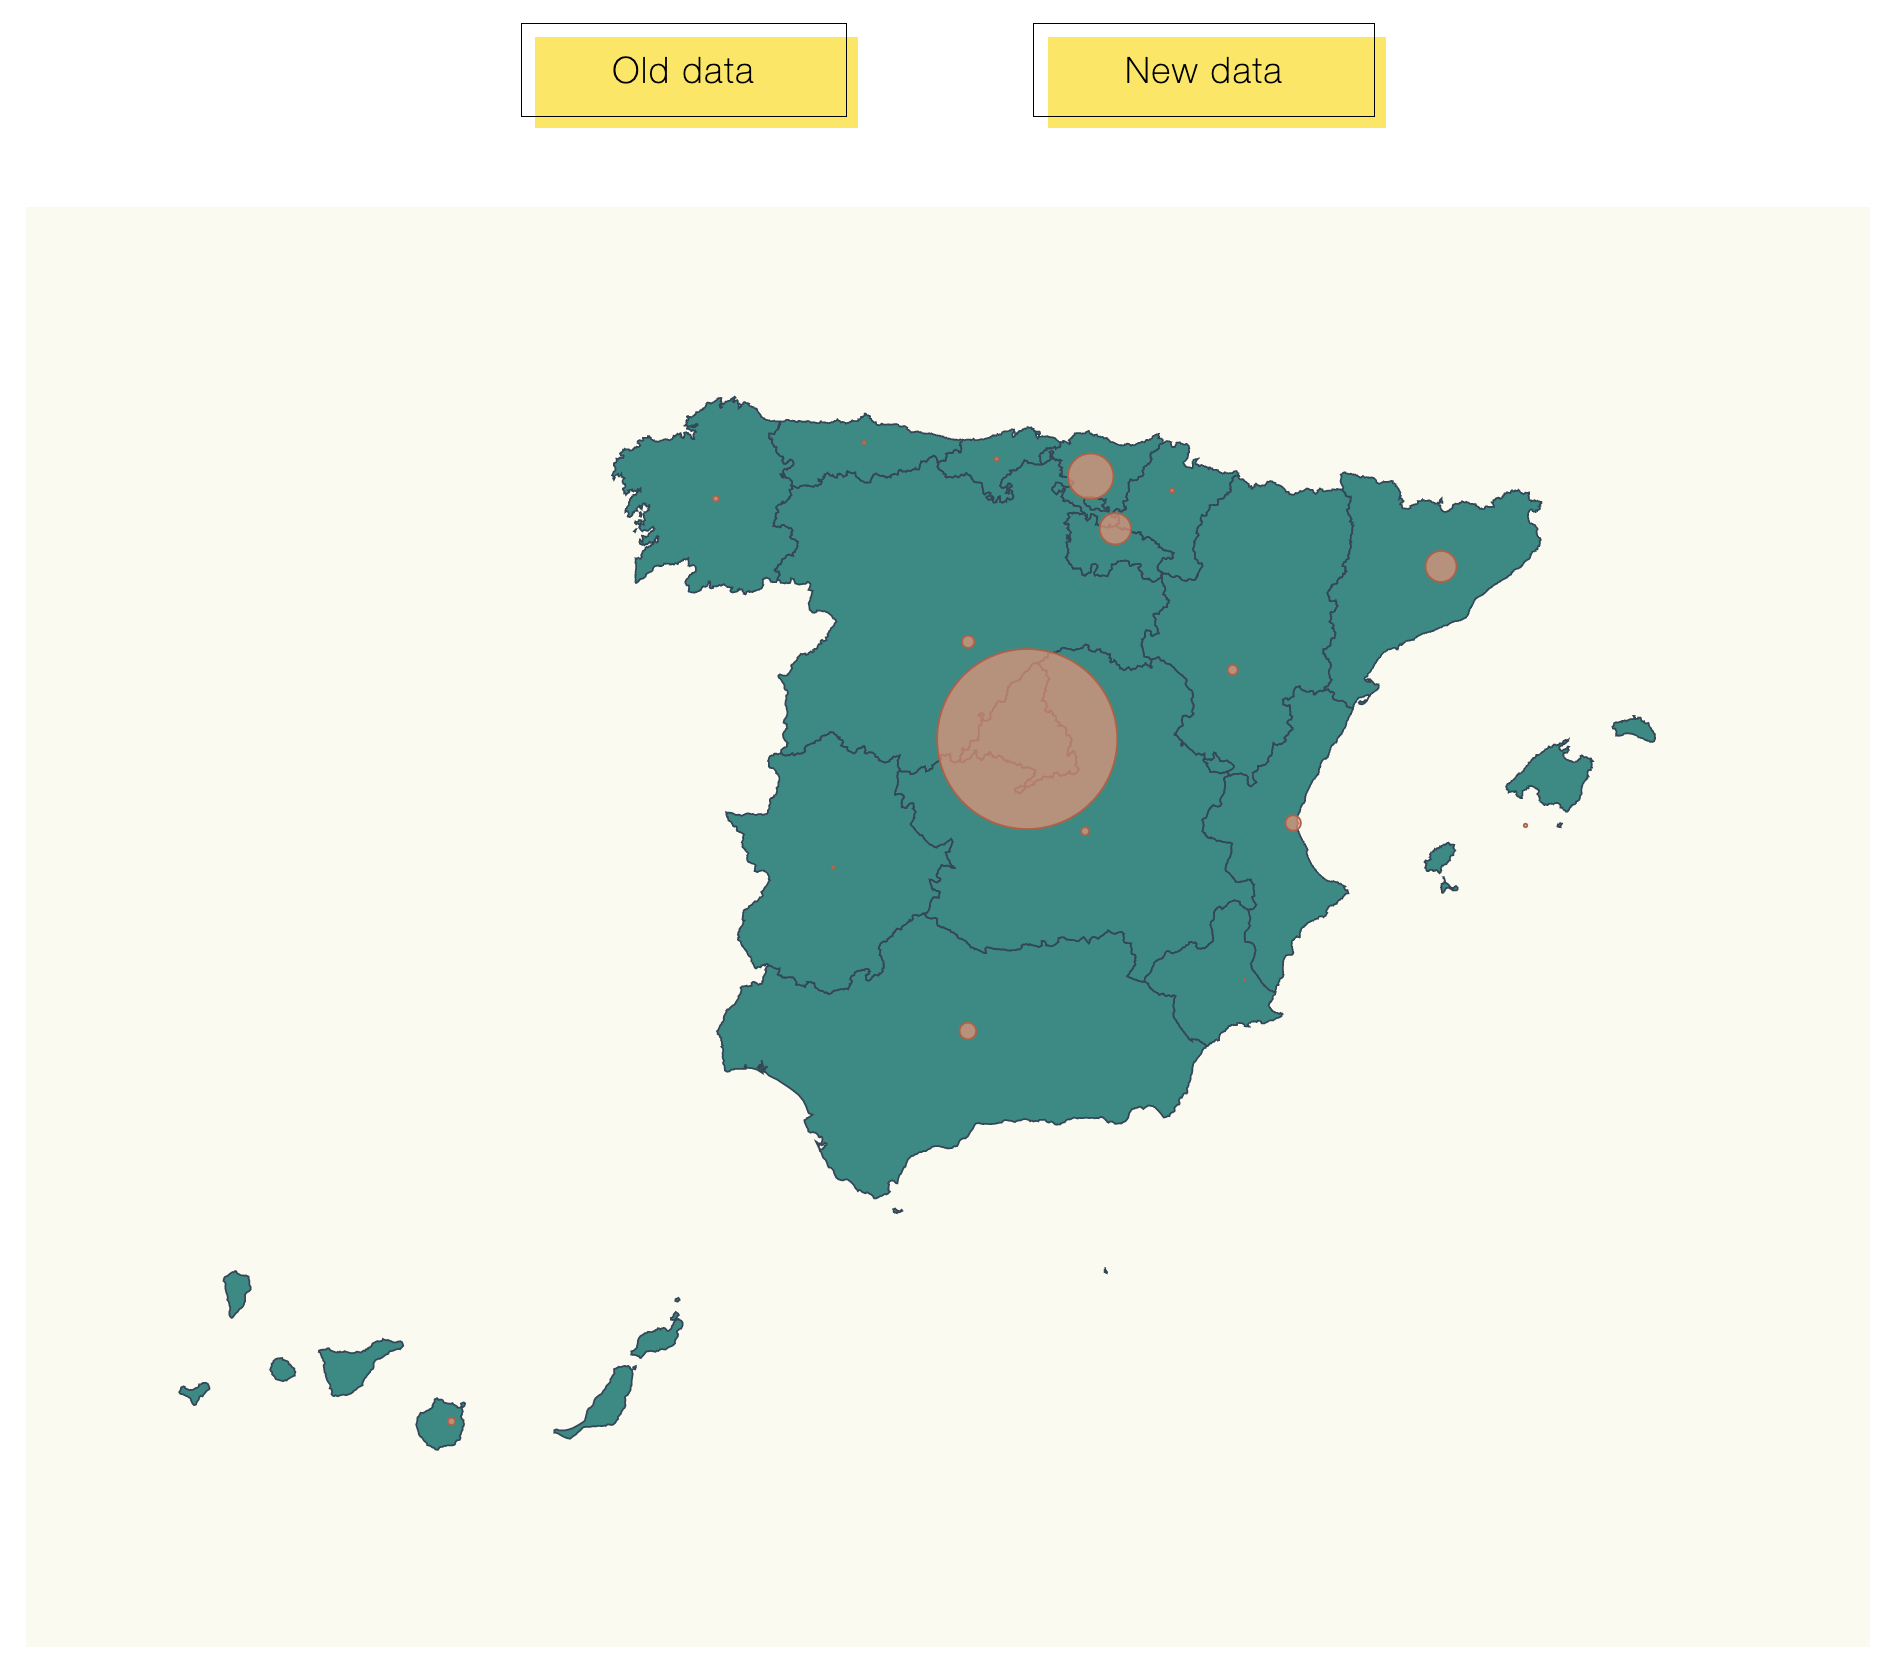
Here you can find a webpage that displays a map from Spain pinning coronavirus affected locations and scaling that pin according the number of cases affected. Additionally, you can choose by pressing the buttons at the above, between "old data" and "new data" meaning the total cases for earlier stage and the last updated data (up to Jul, 17th):
I have performed two main tasks:
- Placed buttons for the different data options.
- Added the transition of data in the map by updating the information (scaling the circles with the new data)
- I have taken as starting point the example 02-maps, copied the content from that folder and added the above described updates.
To do that, I had to clone the GitHub repository and performed the installation of dependencies described in package.json:
- Install npm:
npm install
Then, I had to look for the most updated covid data info for the autonomous communities in Spain. I just googled it and copied the numbers that google collect for us in a new data file: stats_17_jul.ts
export const stats_17_jul = [
    {
      name: "Madrid",
      value: 1880
    },
    {
      name: "La Rioja",
      value: 106
    },
    {
      name: "Andalucía",
      value: 1550
    },
    {
      name: "Cataluña",
      value: 2590
    },
    {
      name: "Valencia",
      value: 1510
    },
    {
      name: "Murcia",
      value: 445
    },
    {
      name: "Extremadura",
      value: 294
    },
    {
      name: "Castilla La Mancha",
      value: 567
    },
    {
      name: "País Vasco",
      value: 755
    },
    {
      name: "Cantabria",
      value: 154
    },
    {
      name: "Asturias",
      value: 249
    },
    {
      name: "Galicia",
      value: 711
    },
    {
      name: "Aragón",
      value: 449
    },
    {
      name: "Castilla y León",
      value: 797
    },
    {
      name: "Islas Canarias",
      value: 425
    },
    {
      name: "Islas Baleares",
      value: 303
    },
    {
      name: "Navarra",
      value: 251
    }
];In order to keep the names in the code for stats, I followed these steps:
- Imported to
index.tsthe "old data"stats.tswith an alias:
import { stats as stats_original} from "./stats";- Imported the "new data" into
index.ts:
import { stats_17_jul } from "./stats_17_jul"- Declare
statsas a variable:
var stats = stats_originalThen, modified the script as follows:
- Declare
updateChartthat usesdataas input (this is the "old stats" or the "updated stats") that would be the change triggered by the user depending on the button clicked. First, thestatsvar will assume thedatavalue. Then,maxAffectedhave to been updated based in the new value of thestats. Next, theaffectedRadiusScaleof the circles representing the cases per autonomous communities have to be resized based on the new value formaxAffectedconstant. The last piece of code selects all the circles in the current map, and performs the transition for the radious size based on the methodcalculateRadiusBasedOnAffectedCasesper everynamevalue in the filelatLongCommunities:
const updateChart = (data: { name: string; value: number; }[]) => {
  stats = data;
  maxAffected = stats.reduce(
    (max, item) => (item.value > max ? item.value : max),
    0
  );
  affectedRadiusScale = d3
  .scaleLinear()
  .domain([0, maxAffected])
  .range([0, 50]);

  svg
  .selectAll("circle")
  .data(latLongCommunities)
  .transition()
  .duration(500)
  .attr("r", d => calculateRadiusBasedOnAffectedCases(d.name));
};
The map and the position of the circles remains tha same after a mouse click in the new buttons, so other changes are not necessary in the updateChart function.
- Next, I had to add the
click button commandfor every button to add. The below code takes thedocumentHTML interface and selects the button by theidattribute. I my case the buttonidsare "old_data" and "new data". Then applies theclick Eventto the button, triggering theupdateChartmethod with the corresponding stats data when the click is performed.
document
  .getElementById("old_data")
  .addEventListener("click",
    () => {updateChart(stats_original)}
  );

document
  .getElementById("new_data")
  .addEventListener("click",
    () => {updateChart(stats_17_jul)}
  );
Changes in index.html
- Under the
<body>, I added the new buttons, using the attributeidto name them andclassas "fill". This way we guarantee the buttons we want to add, appear in the webpage when we display it.
<div>
      <button id="old_data" class="fill"> Old data </button>
      <button id="new_data" class="fill" > New data </button>
</div>
Changes in map.css
- I added the buttons, and centered the webpage. The design was taken from @Joe Bocock using this code, that, from my opinion, matches nicely with the pages aesthetic.
html,
body {
  margin: 0;
  display: flex;
  justify-content: center;
  flex-direction: column;
  align-items: center;
  min-height: 100vh;
  font-family: "Roboto Mono", monospace;
}

button {
  margin: 50px;
  font-family: inherit;
}

.fill {
  font-size: 20px;
  font-weight: 200;
  letter-spacing: 1px;
  padding: 13px 50px 13px;
  outline: 0;
  border: 1px solid black;
  cursor: pointer;
  position: relative;
  background-color: rgba(0, 0, 0, 0);
}

.fill::after {
  content: "";
  background-color: #ffe54c;
  width: 100%;
  z-index: -1;
  position: absolute;
  height: 100%;
  top: 7px;
  left: 7px;
  transition: 0.2s;
}

.fill:hover::after {
  top: 0px;
  left: 0px;
}