Performance analysis for Python.


tuna is a modern, lightweight Python profile viewer inspired by the amazing SnakeViz. It handles runtime and import profiles, is rather small, uses d3 and bootstrap, and avoids certain errors present in SnakeViz.
Create a runtime profile with
python -mcProfile -o program.prof yourfile.py
or an import profile with
python -X importtime yourfile.py 2> import.log
and show it with
tuna program.prof
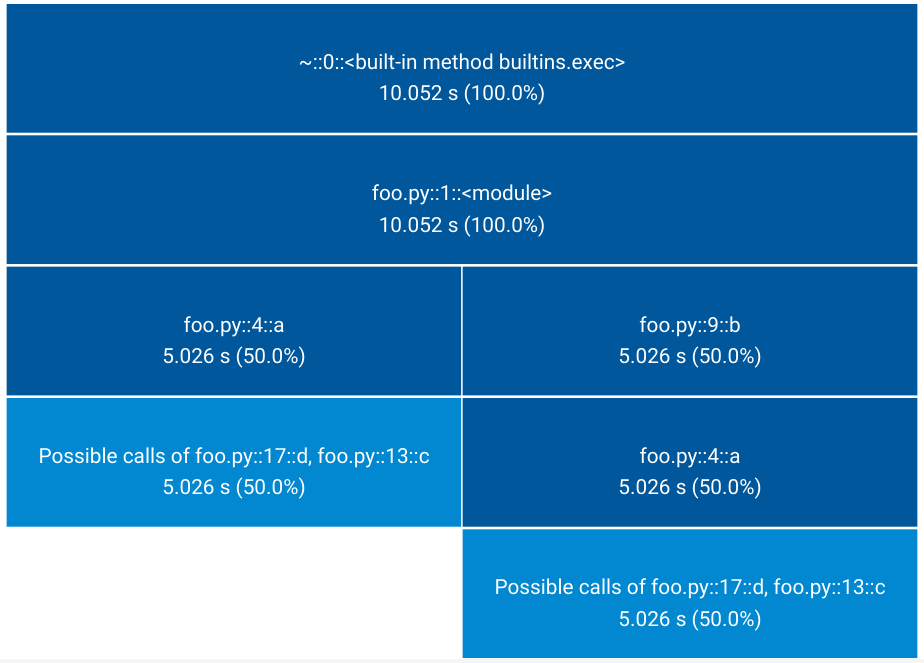
The whole timed call tree cannot be retrieved from profile data. Python developers made the decision to only store parent data in profiles because it can be computed with little overhead. To illustrate, consider the following program.
import time


def a(t0, t1):
    c(t0)
    d(t1)
    return


def b():
    return a(1, 4)


def c(t):
    time.sleep(t)
    return


def d(t):
    time.sleep(t)
    return


if __name__ == "__main__":
    a(4, 1)
    b()
The root process (__main__) calls a() which spends 4 seconds in c() and 1 second
in d(). __main__ also calls b() which calls a(), this time spending 1 second in
c() and 4 seconds in d(). The profile, however, will only store that c() spent a
total of 5 seconds when called from a(), and likewise d(). The information that the
program spent more time in c() when called in root -> a() -> c() than when called in
root -> b() -> a() -> c() is not present in the profile.
tuna only displays the part of the timed call tree that can be deduced from the profile:
tuna is available from the Python Package Index, so simply type
pip3 install tuna --user --upgrade
to install or upgrade.
To run the tuna unit tests, check out this repository and type
pytest
tuna is published under the MIT license.