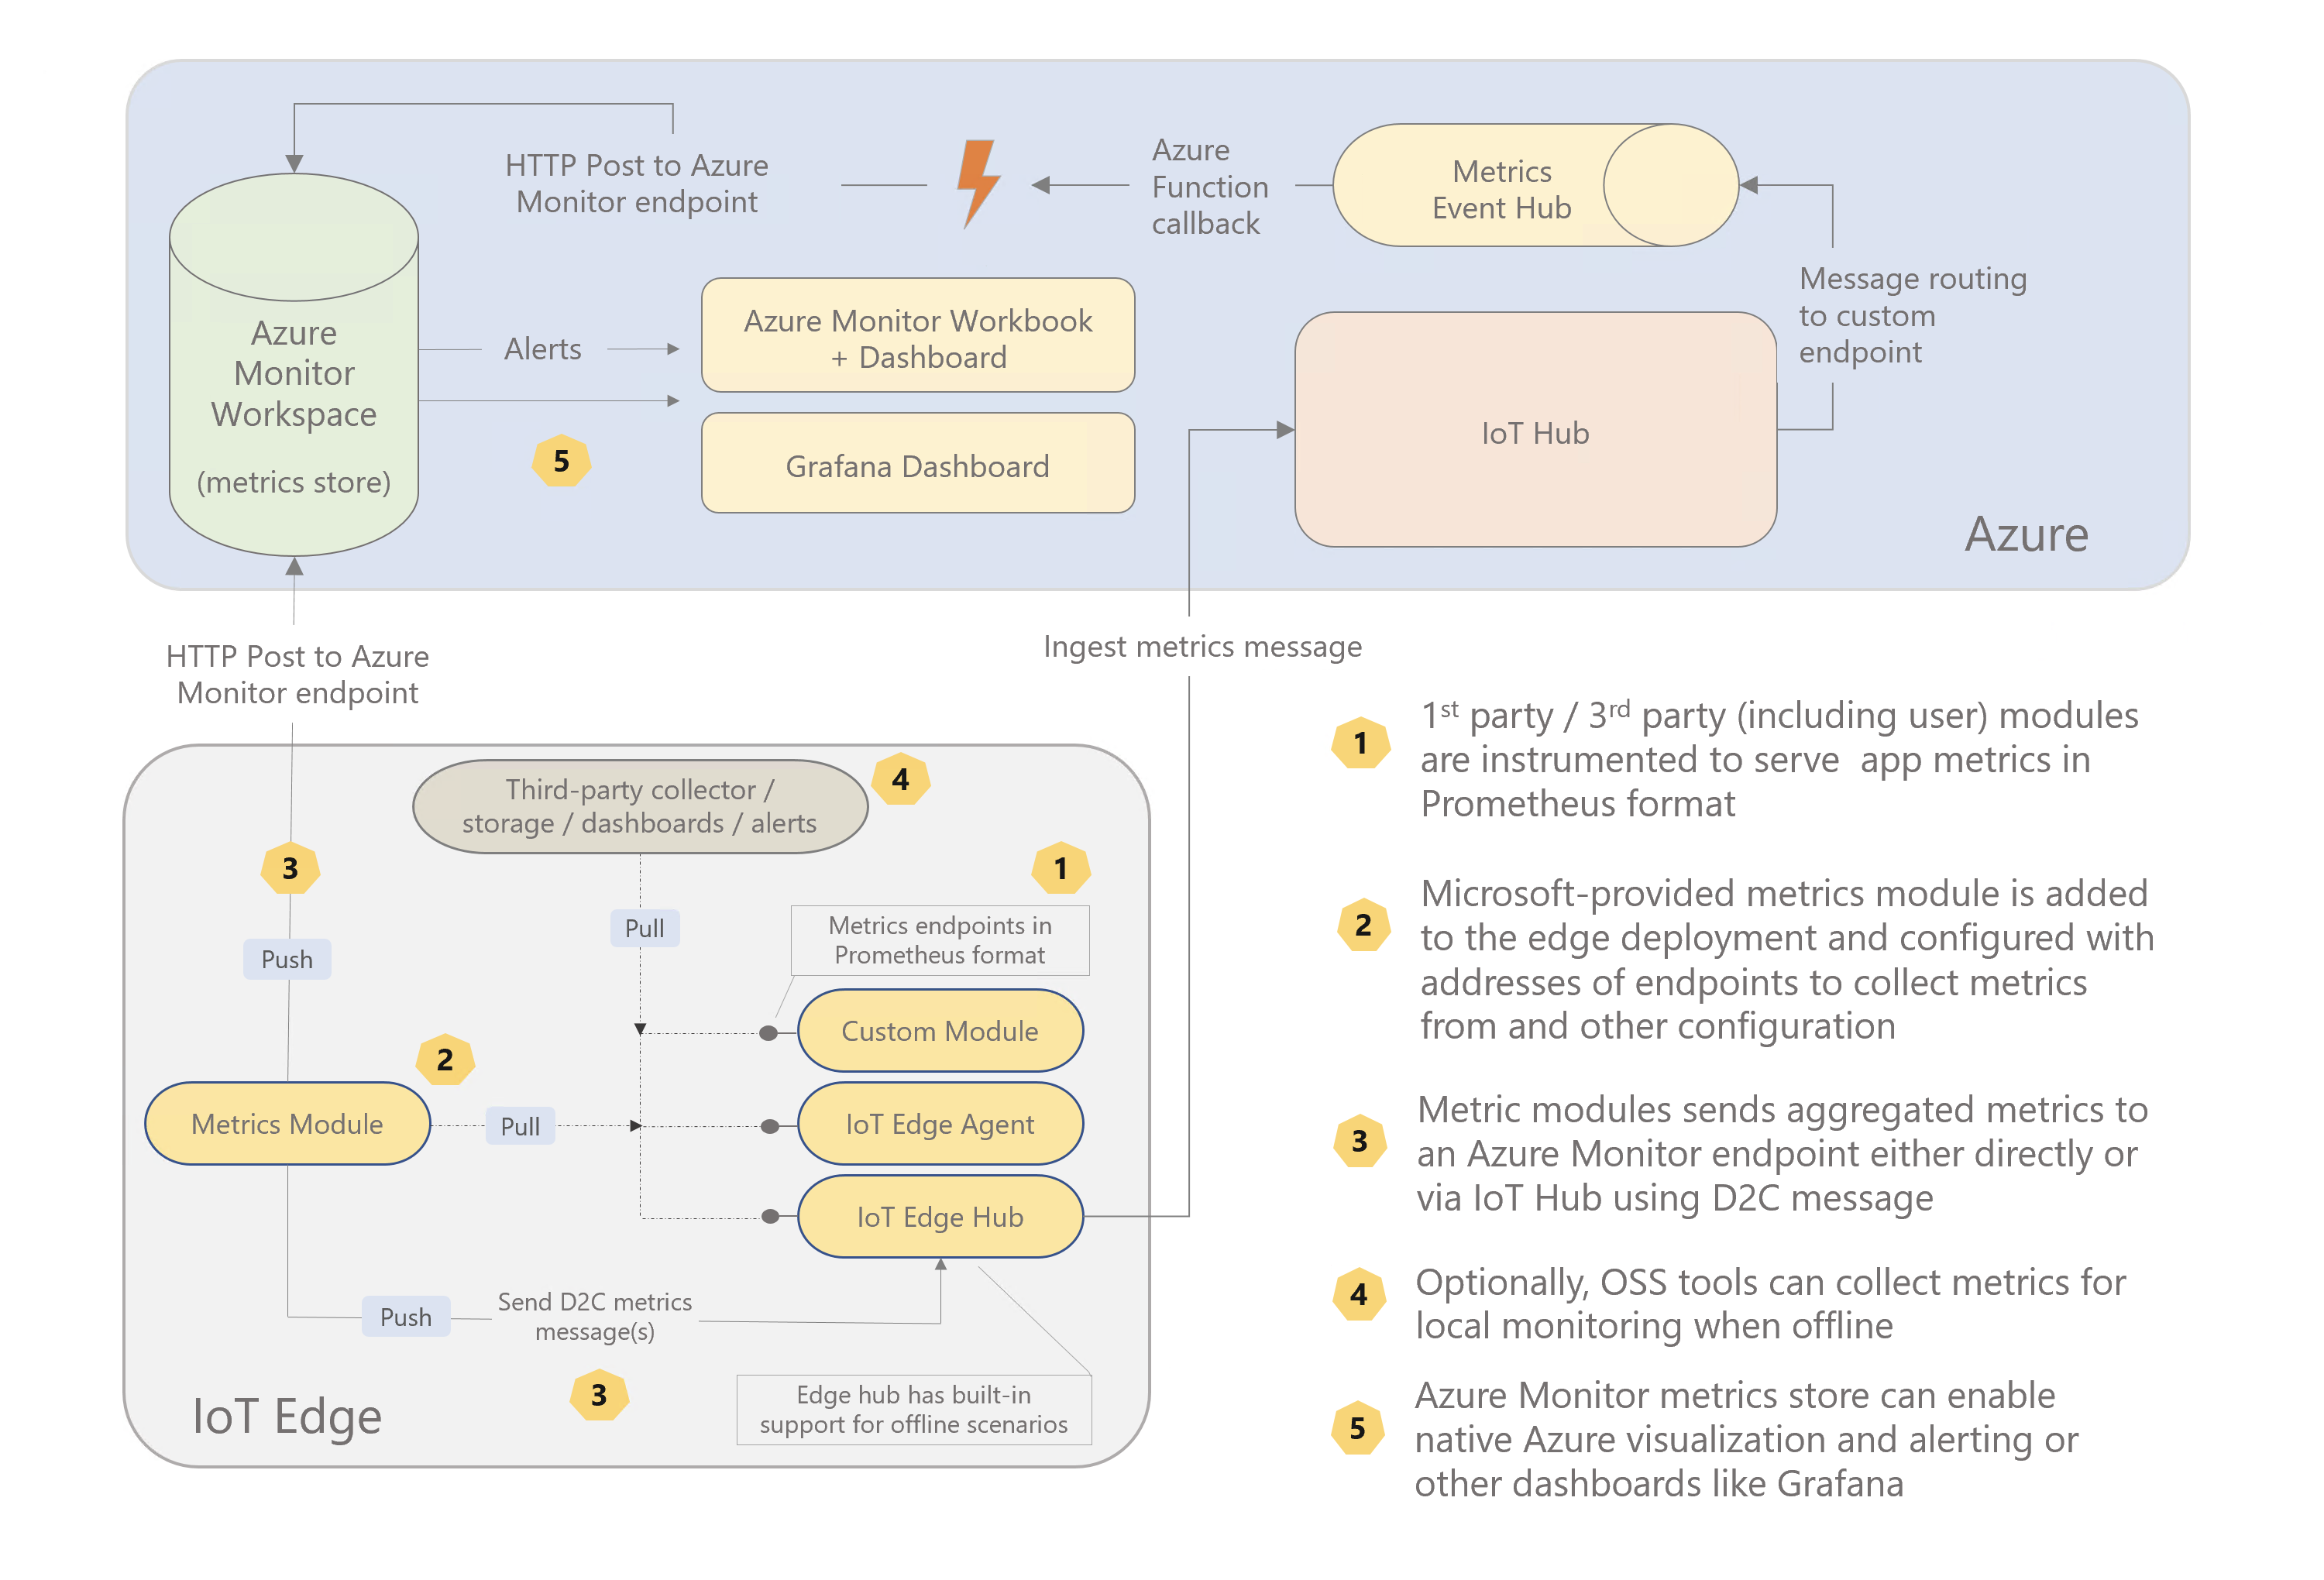
-
Create an Azure Log Analytics workspace and note its workspace ID and key.
-
Use IoT Edge Hub with tag
1.0.9-rc2and following configuration:# Linux settings "edgeHub": { "settings": { "image": "mcr.microsoft.com/azureiotedge-hub:1.0.9-rc2", "createOptions": "{\"ExposedPorts\":{\"9600/tcp\":{},\"5671/tcp\":{},\"8883/tcp\":{}}}" }, "type": "docker", "env": { "experimentalfeatures__enabled": { "value": true }, "experimentalfeatures__enableMetrics": { "value": true } }, "status": "running", "restartPolicy": "always" } # Windows settings (requires running as 'ContainerAdministrator' for now) "edgeHub": { "settings": { "image": "mcr.microsoft.com/azureiotedge-hub:1.0.9-rc2", "createOptions": "{\"User\":\"ContainerAdministrator\",\"ExposedPorts\":{\"9600/tcp\":{},\"5671/tcp\":{},\"8883/tcp\":{}}}" }, "type": "docker", "env": { "experimentalfeatures__enabled": { "value": true }, "experimentalfeatures__enableMetrics": { "value": true } }, "status": "running", "restartPolicy": "always" }
-
Add the metricscollector module to the deployment:
Linux amd64 image Windows amd64 image veyalla/metricscollector:0.0.4-amd64veyalla/metricscollector:0.0.5-windows-amd64Desired properties for metricscollector
Name Description Type schemaVersionSet to "1.0" string scrapeFrequencySecsMetrics collection period in seconds. Increase or decrease this number depending on how often you want to collect metrics data. int metricsFormatSet to "Json" or "Prometheus". Note, the metrics endpoints are expected to be in Prometheus format. If set to "Json", the metrics are converted JSON format in the collector module string syncTargetSet to "AzureLogAnalytics" or "IoTHub" When set to "AzureLogAnalytics", environment variables AzMonWorkspaceIdandAzMonWorkspaceKeyneed to be setstring endpointsA JSON section containing name and collection URL key-value pairs. JSON section Sometimes you might see a timeout error in metricscollector during the first collection, subsequent collection attempts (after configurated collection period) should succeed. This is because IoT Edge doesn't provide module start order guarantees and it might start this module before edgeHub's metrics endpoint is ready.
Sending metrics to Azure Monitor directly
Set the following environment variables for this module:
Name Value AzMonWorkspaceIdWorkspace ID from Step 1 AzMonWorkspaceKeyWorkspace key from Step 1 Desired properties for the module:
"properties.desired": {
    "schemaVersion": "1.0",
    "scrapeFrequencySecs": 300,
    "metricsFormat": "Json",
    "syncTarget": "AzureLogAnalytics",
    "endpoints": {
        "edgeHub": "http://edgeHub:9600/metrics"
    }
}
💣 If you're using the portal, remove the
"properties.desired"text as it's added automatically. See the screenshot below:Sending metrics to Azure Monitor via IoT Hub
As shown in the architecture diagram it is also possible to send data to Azure Monitor via IoT Hub. This pattern is useful in scenarios where the edge device cannot communicate to any other external endpoint other than IoT Hub. Store and forward (leveraging the IoT Edge Hub) of metrics data when the device is offline is another useful property of this pattern.
However, this requires some cloud infra setup for routing metricsCollector messages to a different Event Hub which are then picked up by a Azure Function and sent to an Azure Monitor workspace.
I've found Pulumi, an infrastructure-as-code tool, to be an easy and pleasant way of setting this up. The routeViaIoTHub folder contains the code I used. If you already have existing resources, you can use Pulumi to import them or if don't want to use Pulumi, you can take the Azure Function logic and deploy it via your preferred method.
This pattern doesn't require any Azure Monitor credentials on the device side. Simply use
IoTHubas thesyncTargetlike so:"properties.desired": { "schemaVersion": "1.0", "scrapeFrequencySecs": 300, "metricsFormat": "Json", "syncTarget": "IoTHub", "endpoints": { "edgeHub": "http://edgeHub:9600/metrics" } }
Ensure there is a route defined in the deployment to Edge Hub:
FROM /messages/modules/metricscollector/* INTO $upstream
Deploy the Azure Monitor Workbook template by following the instructions from here.
Here is a screenshot of the visualization that Workbook provides:

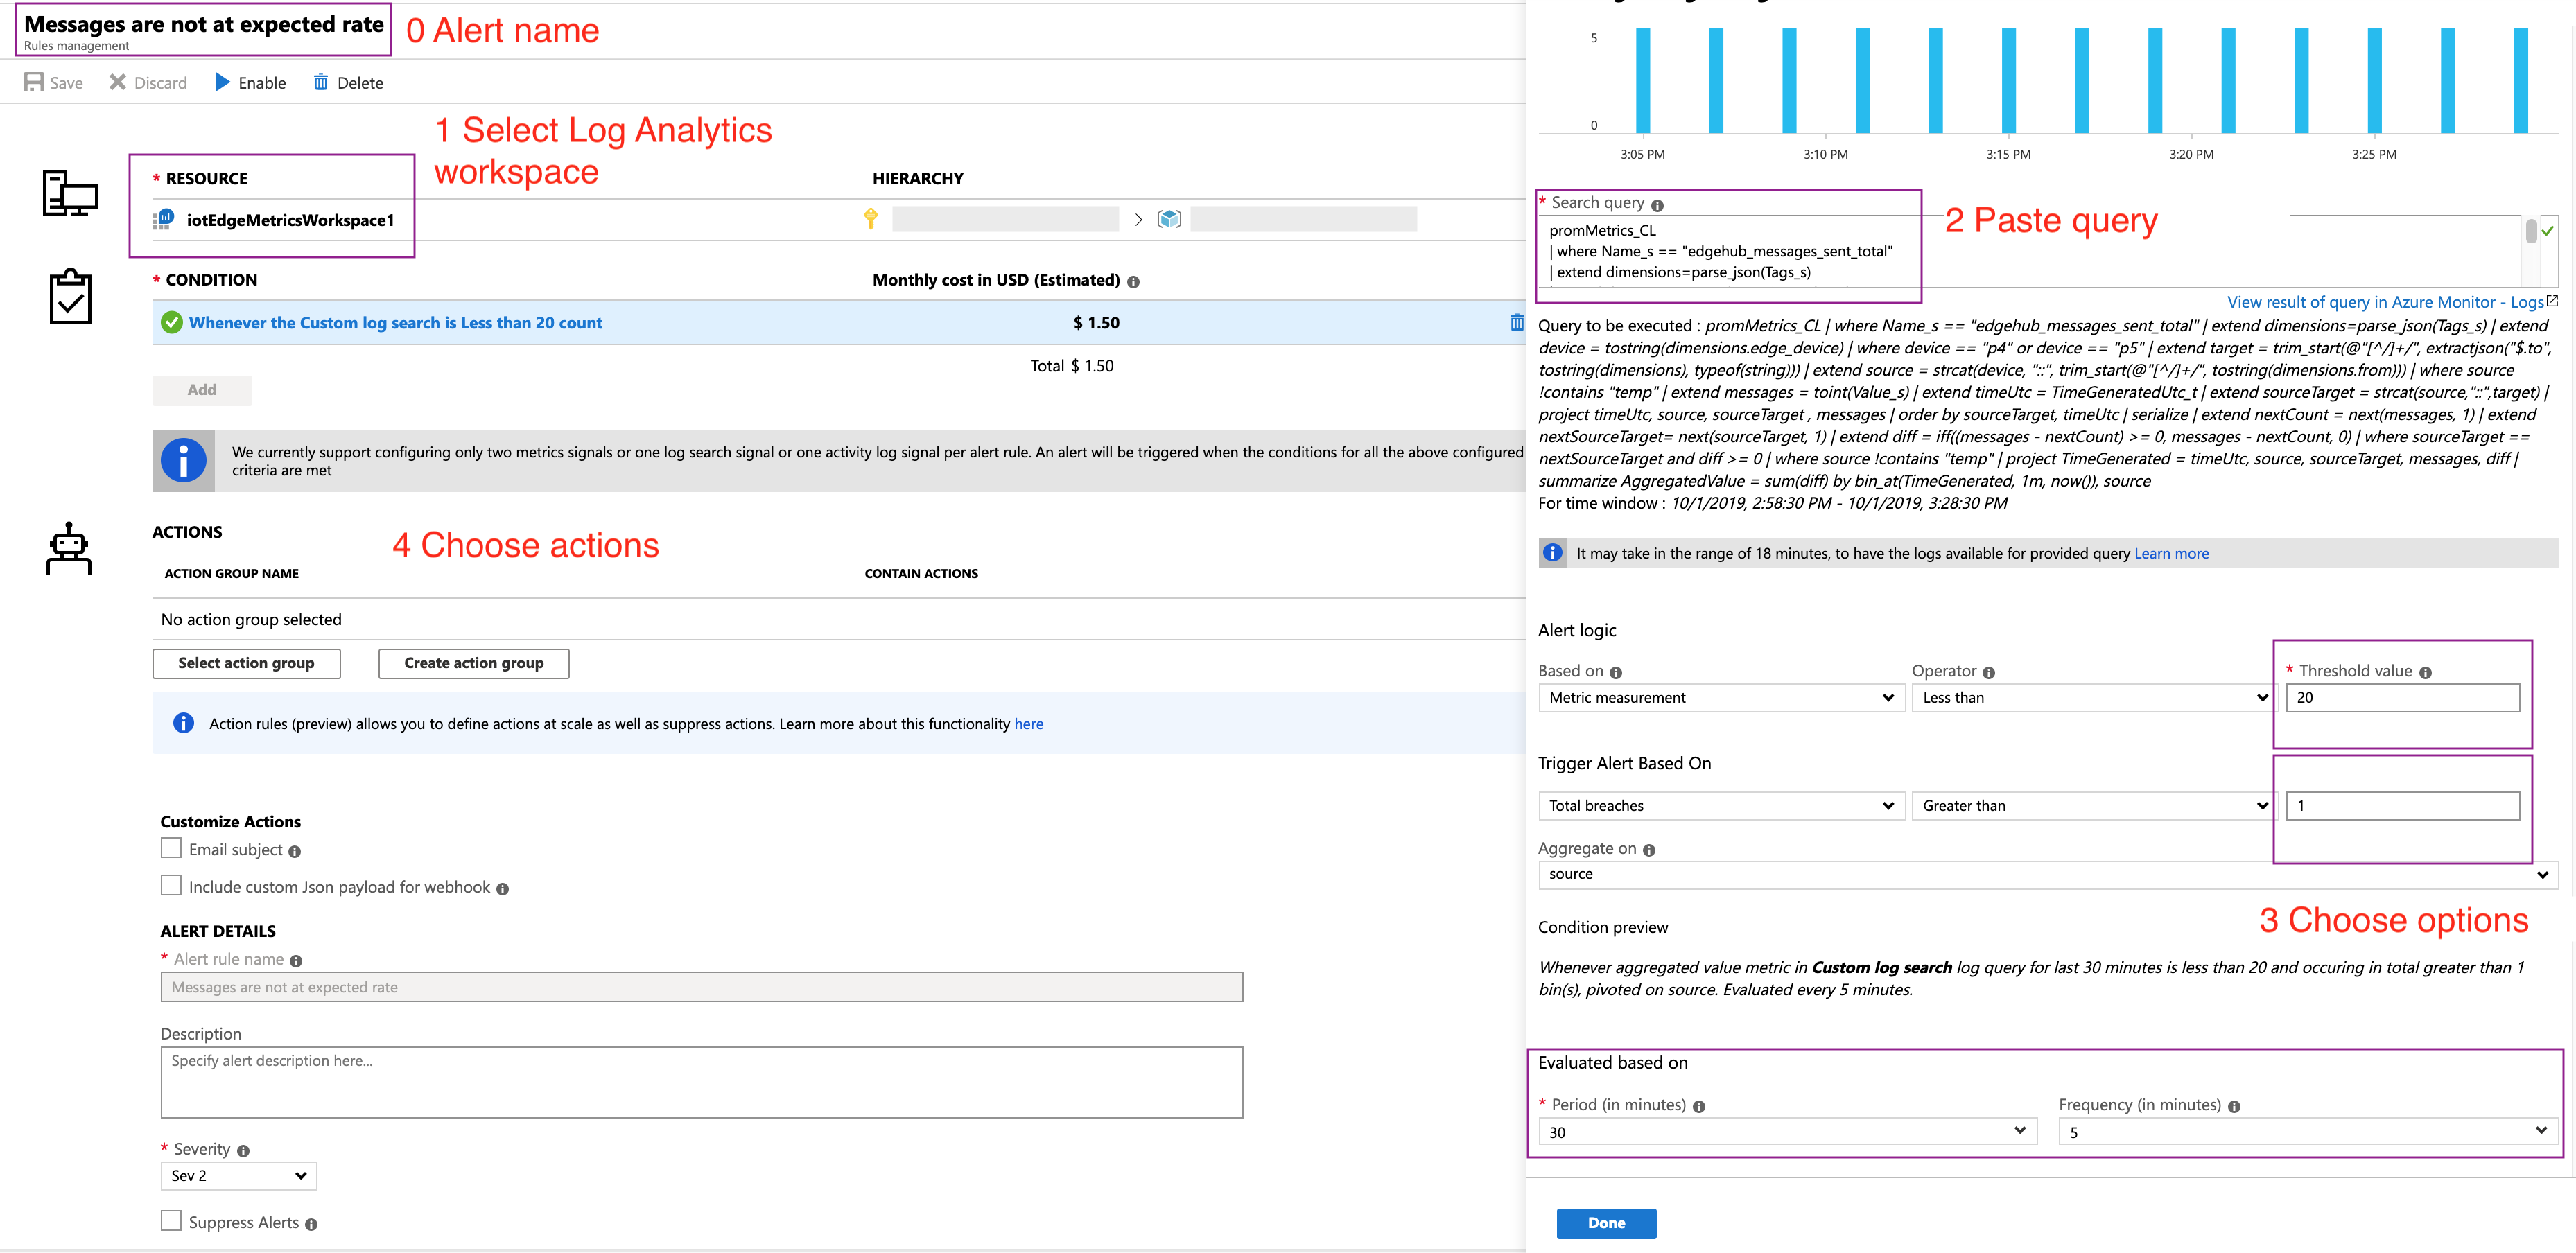
Log-based alerts can be configured for generating alerts on unexpected conditions.
promMetrics_CL
| where Name_s == "edgehub_messages_sent_total"
| extend dimensions=parse_json(Tags_s)
| extend device = tostring(dimensions.edge_device)
| extend target = trim_start(@"[^/]+/", extractjson("$.to", tostring(dimensions), typeof(string)))
| extend source = strcat(device, "::", trim_start(@"[^/]+/", tostring(dimensions.from)))
| extend messages = toint(Value_s)
| extend timeUtc = TimeGeneratedUtc_t
| extend sourceTarget = strcat(source,"::",target)
| project  timeUtc, source, sourceTarget , messages
| order by sourceTarget, timeUtc
| serialize
| extend nextCount = next(messages, 1)
| extend nextSourceTarget= next(sourceTarget, 1)
| extend diff = iff((messages - nextCount) >= 0, messages - nextCount, 0)
| where sourceTarget  == nextSourceTarget and diff >= 0
| project  TimeGenerated = timeUtc, source, sourceTarget, messages, diff
| summarize AggregatedValue = sum(diff) by  bin(TimeGenerated, 1m), source
The query can be modified to filter to specific devices or modules.
Assumes all received messages are sent upstream.
let set1 = promMetrics_CL
| where Name_s == "edgehub_messages_sent_total"
| extend dimensions=parse_json(Tags_s)
| extend device = tostring(dimensions.edge_device)
| extend target = trim_start(@"[^/]+/", extractjson("$.to", tostring(dimensions), typeof(string)))
| extend source = strcat(device, "::", trim_start(@"[^/]+/", tostring(dimensions.from)))
| extend messages = toint(Value_s)
| extend timeUtc = TimeGeneratedUtc_t
| extend sourceTarget = strcat(source,"::",target)
| where sourceTarget contains "upstream"
| order by sourceTarget, timeUtc
| serialize
| extend nextCount = next(messages, 1)
| extend nextSourceTarget= next(sourceTarget, 1)
| extend diff = iff((messages - nextCount) >= 0, messages - nextCount, 0)
| where sourceTarget == nextSourceTarget and diff >= 0
| project  timeUtc, source, sourceTarget, diff
| summarize maxMsg=sum(diff), lastestTime=max(timeUtc) by source
| project lastestTime, source, maxMsg;
let set2 = promMetrics_CL
| where Name_s == "edgehub_messages_received_total"
| extend dimensions=parse_json(Tags_s)
| extend device = tostring(dimensions.edge_device)
| extend source = strcat(device, "::", trim_start(@"[^/]+/", tostring(dimensions.id)))
| extend messages = toint(Value_s)
| extend timeUtc = TimeGeneratedUtc_t
| order by source, timeUtc
| serialize
| extend nextCount = next(messages, 1)
| extend nextSource= next(source, 1)
| extend diff = iff((messages - nextCount) >= 0, messages - nextCount, 0)
| where source == nextSource and diff >= 0
| project  timeUtc, source, diff
| summarize maxMsgRcvd=sum(diff), lastestTime=max(timeUtc) by source
| project lastestTime, source, maxMsgRcvd;
set1
| join set2 on source
| extend delta=maxMsgRcvd-maxMsg
| project TimeGenerated=lastestTime, source, maxMsg, maxMsgRcvd, delta
| summarize AggregatedValue = max(delta) by bin_at(TimeGenerated, 30m, (now() - 5m)), source


