QuickPizza is a web application, used for demonstrations and workshops, that generates new and exciting pizza combinations!
The app is built using SvelteKit for the frontend and Go for the backend.
The tests written for QuickPizza demonstrates the basic and advanced functionalities of k6, ranging from a basic load test to using different modules and extensions. QuickPizza is used in the the k6-oss-workshop.
- Docker
- Grafana k6 (v.0.46.0 or higher)
To run the app locally with Docker, run the command:
docker run --rm -it -p 3333:3333 ghcr.io/grafana/quickpizza-local:latestor build image from the repo:
docker run --rm -it -p 3333:3333 $(docker build -q .)That's it!
Now you can go to localhost:3333 and get some pizza recommendations!
All tests live in the k6 folder. Within this folder, you will find the following folders:
- foundations - covers the basic functionalities of k6.
- browser - covers the k6 browser module for browser and web performance testing.
- extensions - covers basic tests using k6 extensions.
- disruptor - covers a more deep-dive look on how to use xk6-disruptor for failure injection testing.
To run tests on the foundations folder, you can use the following commands:
cd k6/foundations
k6 run 01.basic.js
If you want to run one iteration with one virtual user, you can use the following command:
k6 run --iterations 1 --vus 1 01.basic.jsIf QuickPizza is deployed remotely, then pass the hostname and port through the BASE_URL environment variable as follows:
k6 run -e BASE_URL=https://acmecorp.dev:3333 01.basic.jsUsing k6 extensions
If the test uses an extension, you need to build a k6 binary that includes the required extension/s. For detailed instructions, refer to k6 docs:cd k6/extensions
xk6 build --with xk6-internal=../internalTo run the test that uses the k6/x/internal module, use previously created k6 binary in the k6/extensions folder:
./k6 run 01.basic-internal.jsUsing k6 Docker image
If you want to use the k6 Docker image to run k6, you need to run the Quickpizza and k6 containers within the same network.
First, create a Docker network. Then, run Quickpizza, assigning a hostname and connecting to the created network.
docker network create quickpizza_network
docker run --network=quickpizza_network --hostname=quickpizza --rm -it -p 3333:3333  ghcr.io/grafana/quickpizza-local:latest
Next, you can use the k6 Docker image to execute the k6 test. Run the k6 Docker container within the same network (quickpizza_network) and pass the BASE_URL environment variable with the value of the Quickpizza container's hostname as follows:
docker run -i --network=quickpizza_network -e BASE_URL=http://quickpizza:3333 grafana/k6 run - <01.basic.jsTesting something you can't observe is only half the fun. QuickPizza is instrumented using best practices to record logs, emit metrics, traces and allow profiling. You can either collect and store this data locally or send it to Grafana Cloud.
If you encounter any issues during operation, you can enable debug logging by setting the following evironment variable:
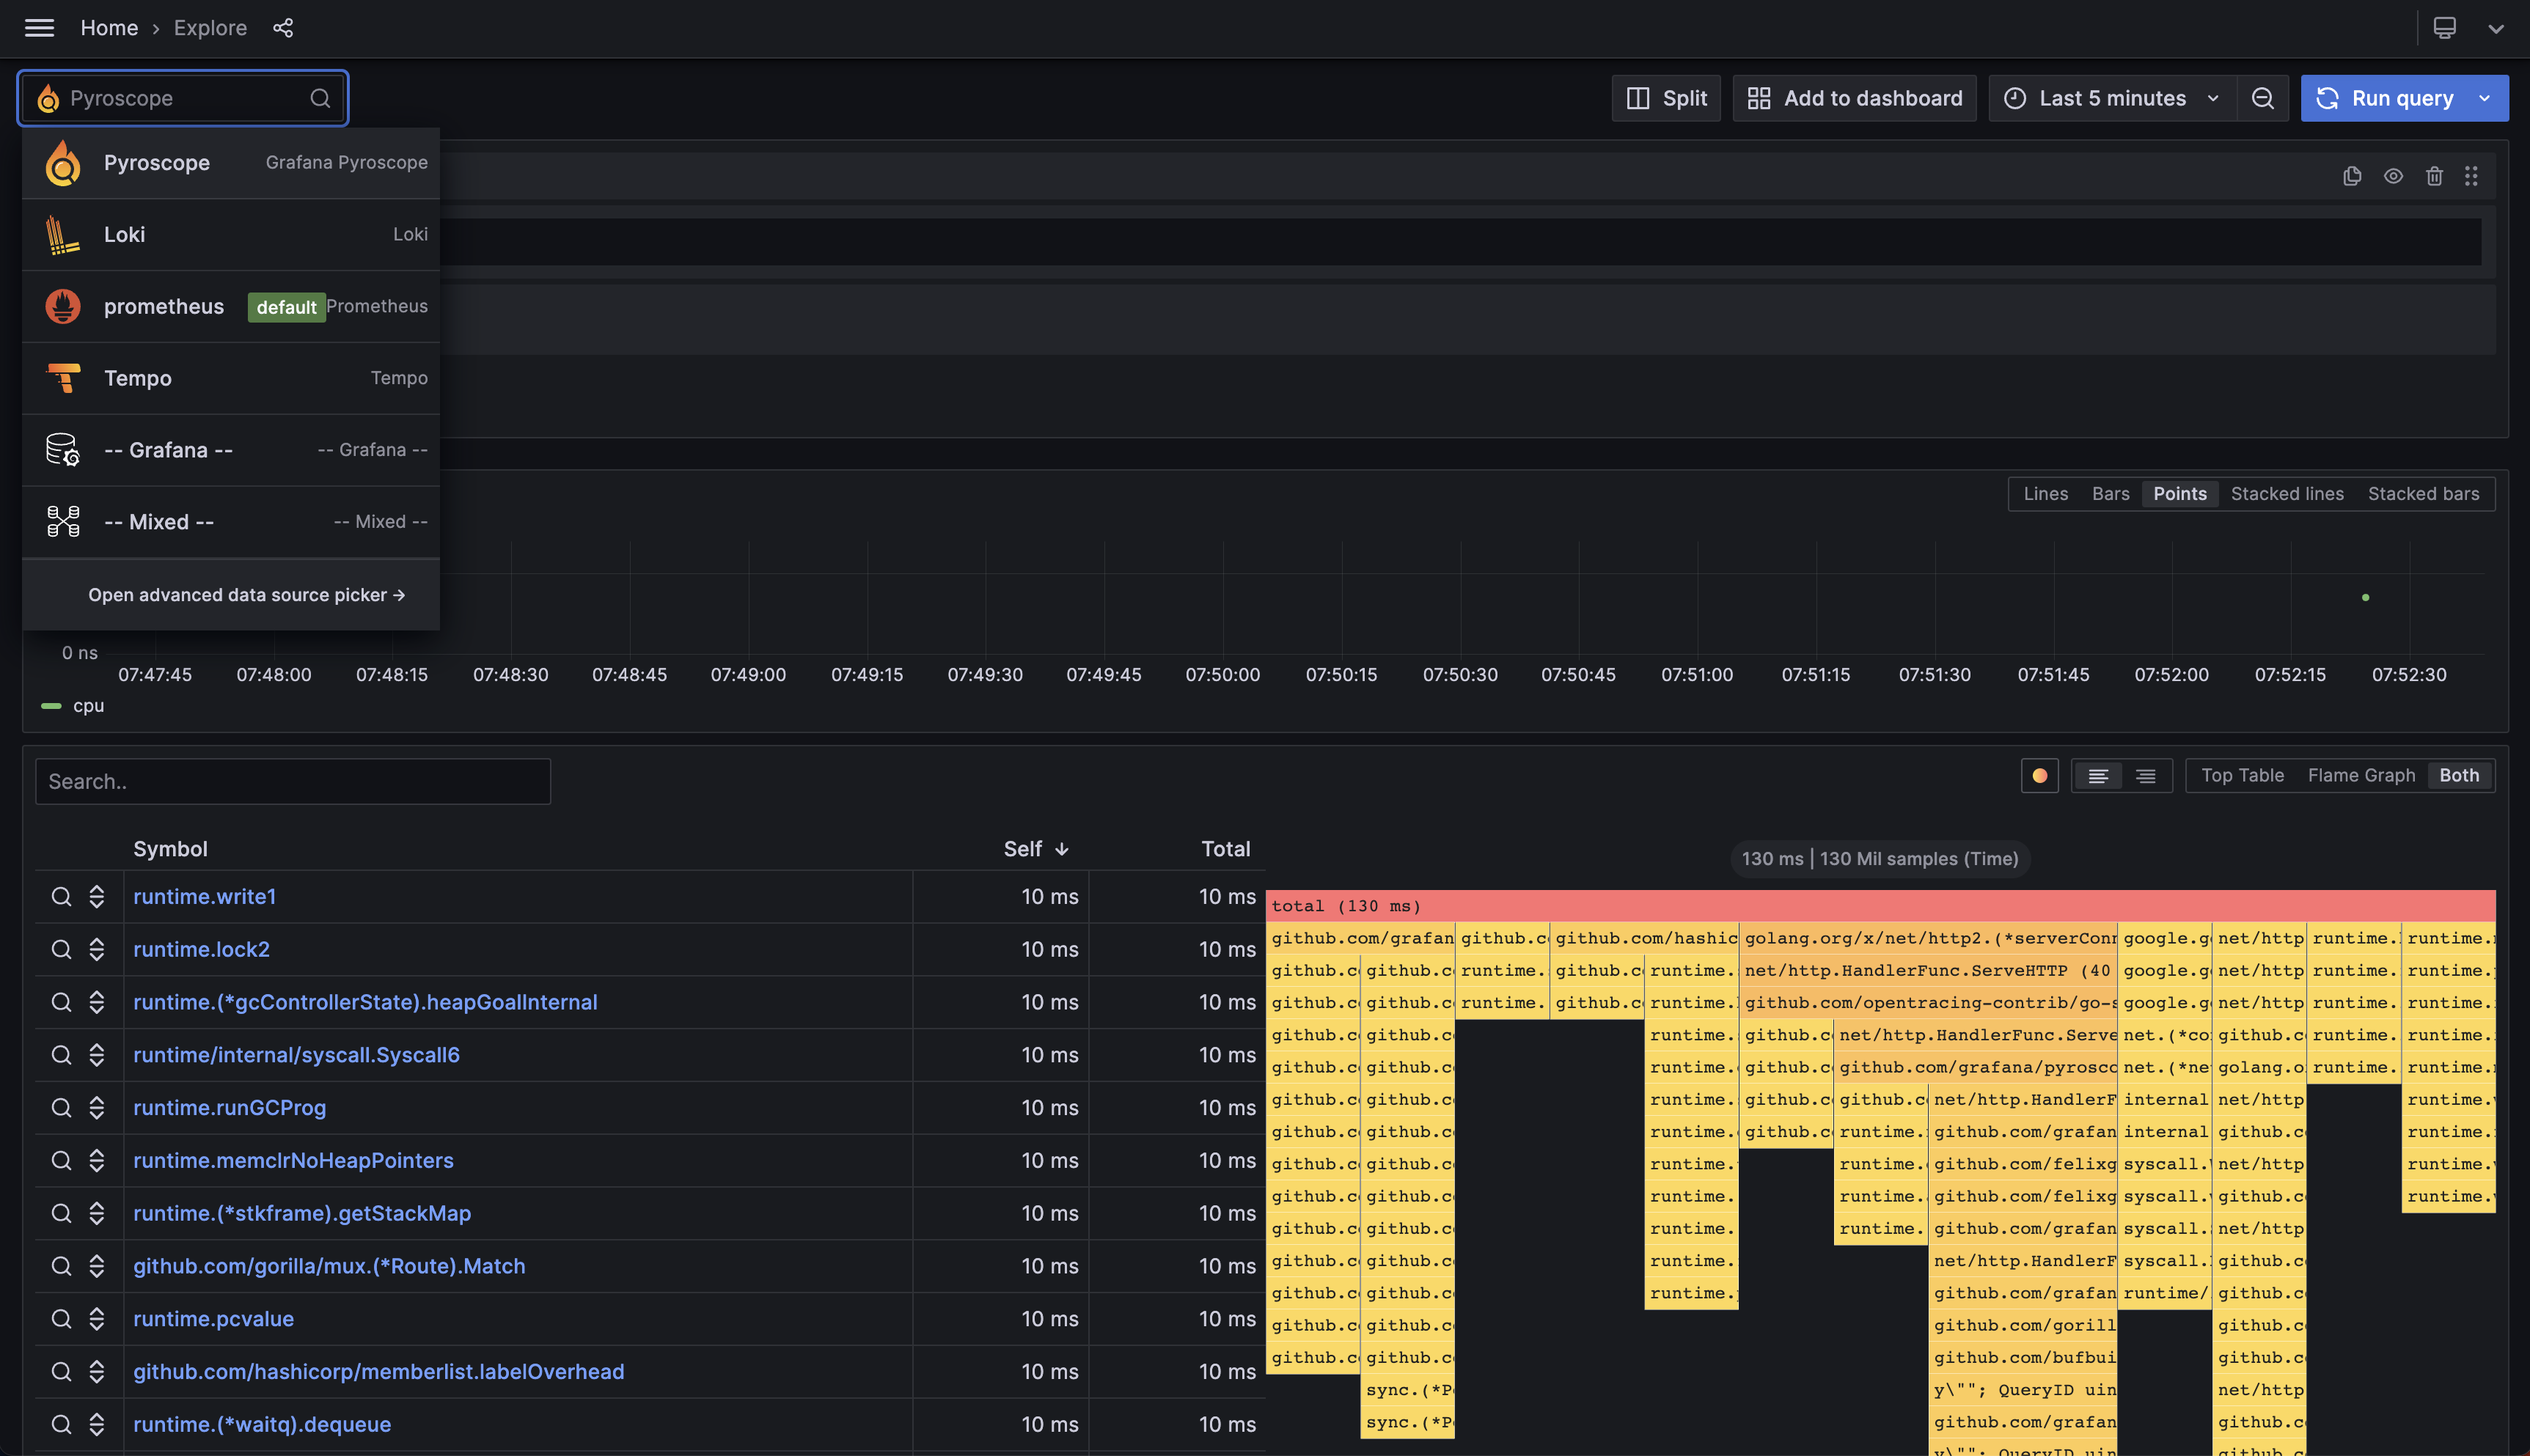
export QUICKPIZZA_LOG_LEVEL=debugThe docker-compose-local.yaml file is set up to run and orchestrate the QuickPizza, Grafana, Tempo, Loki, Prometheus, Pyroscope, and Grafana Agent containers.
The Grafana Agent collects traces, metrics, logs and profiling data from the QuickPizza app, forwarding them to the Tempo, Prometheus, Loki and Pyroscope services. Finally, you can visualize and correlate data stored in these containers with the locally running Grafana instance.
To start the local environment, use the following command:
docker compose -f docker-compose-local.yaml up -dLike before, QuickPizza is available at localhost:3333. It's time to discover some fancy pizzas!
Then, you can visit the Grafana instance running at localhost:3000 to access QuickPizza data.
Please refer to agent-local.river and docker-compose-local.yaml to find the labels applied to the telemetry data.
Send k6 results to Prometheus and visualize them with prebuilt dashboards
To send k6 results to the Prometheus instance, execute the k6 run command with the value of the output flag set to experimental-prometheus-rw as follows:
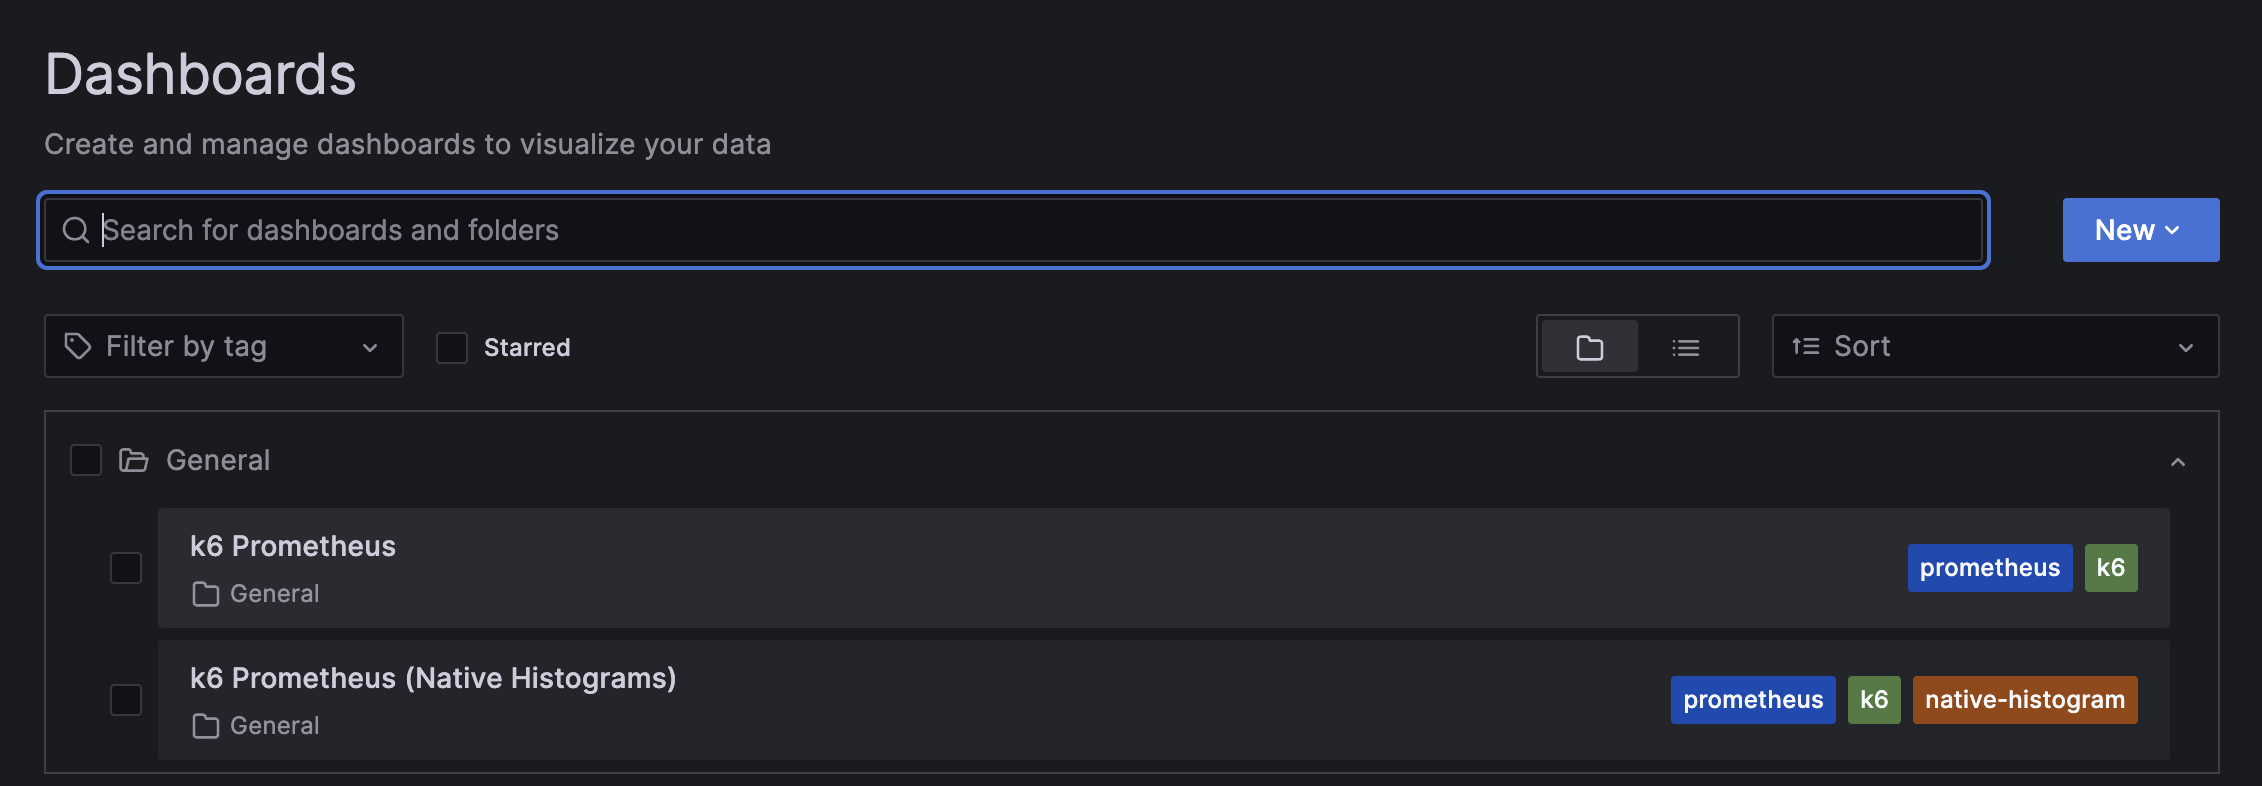
k6 run -o experimental-prometheus-rw 01.basic.jsThe local Grafana instance includes the k6 Prometheus and k6 Prometheus (Native Histogram) dashboards to help visualize, query, and correlate k6 results with telemetry data.
For detailed instructions about the different options of the k6 Prometheus output, refer to the k6 output guide for Prometheus remote write.
The docker-compose-cloud.yaml file is set up to run the QuickPizza and Grafana Agent containers.
In this setup, the Grafana Agent collects observability data from the QuickPizza app and forwards it to Grafana Cloud.
You will need the following settings:
- The name of the Grafana Cloud Stack where the telemetry data will be stored.
- An Access Policy Token that includes the following scopes for the selected Grafana Cloud Stack:
stacks:read,metrics:write,logs:write,traces:write, andprofiles:write.
Then, create an .env file with the following environment variables and the values of the previous settings:
GRAFANA_CLOUD_STACK=name
GRAFANA_CLOUD_TOKEN=
Finally, execute the Docker Compose command using the docker-compose-cloud.yaml file, just as in the local setup:
docker compose -f docker-compose-cloud.yaml up -dQuickPizza is available at localhost:3333. Click the Pizza, Please! button and discover some awesome pizzas!
Now, you can log in to Grafana Cloud and explore QuickPizza's telemetry data on the Prometheus, Tempo, Loki, and Pyroscope instances of your Grafana Cloud Stack. Refer to agent-cloud.river and docker-compose-cloud.yaml to find the labels applied to the telemetry data.
Enable Frontend observability (Grafana Faro)
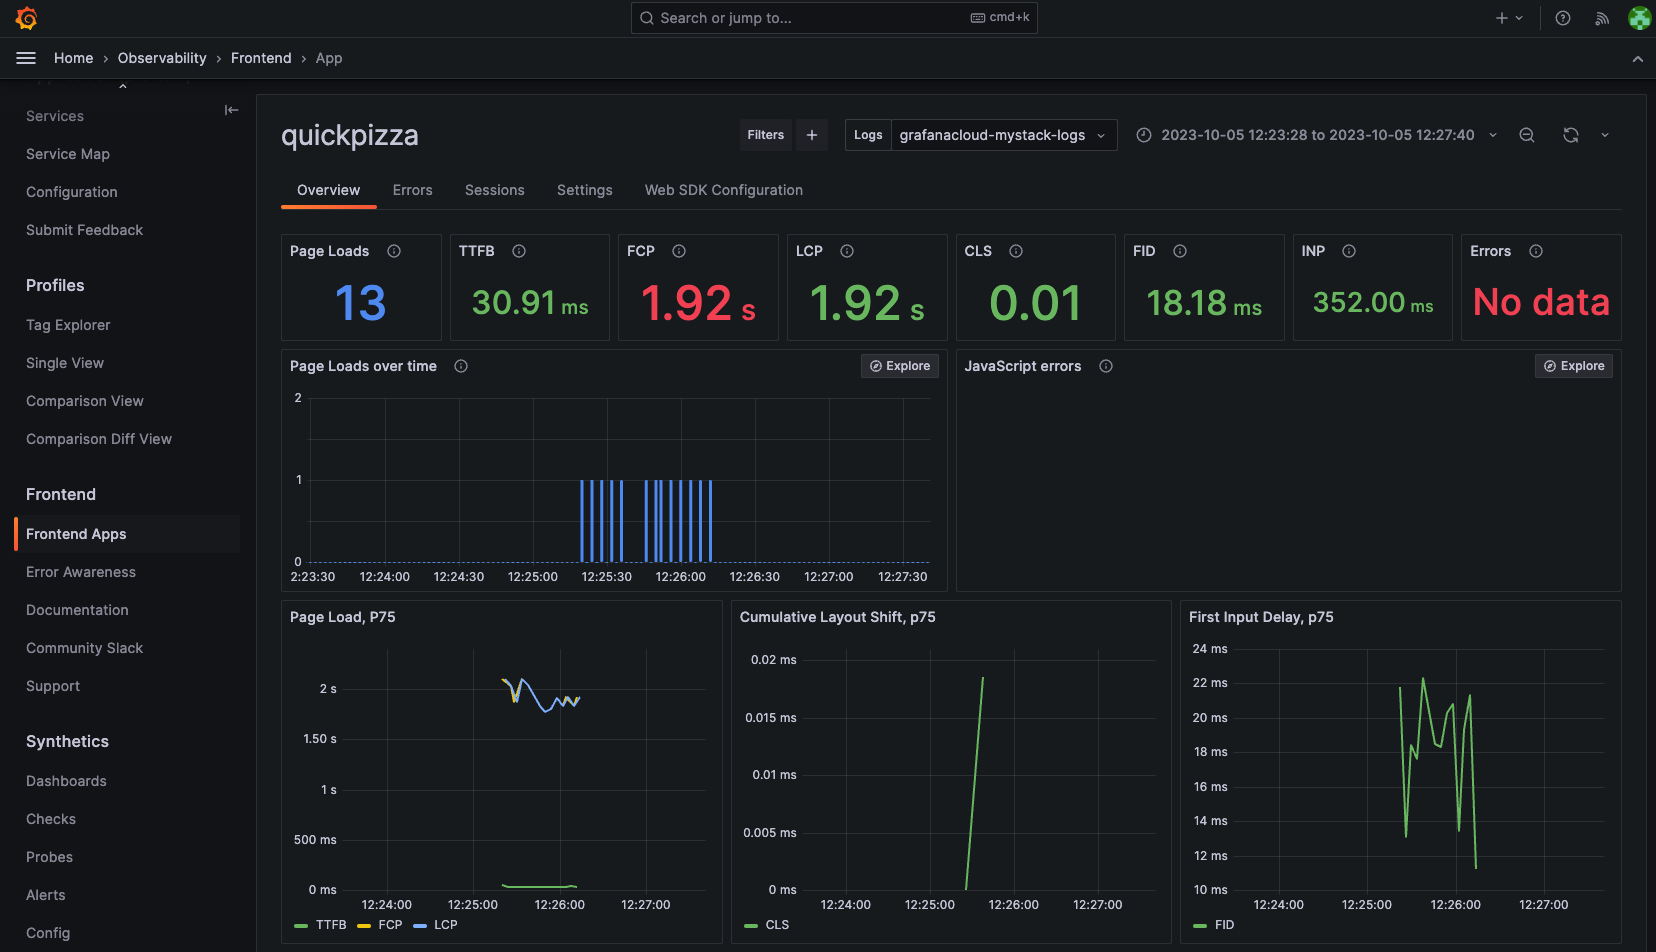
Frontend observability is available exclusively in Grafana Cloud. To enable Grafana Cloud Frontend Observability for QuickPizza, add the QUICKPIZZA_CONF_FARO_URL variable to the .env file, setting its value to your Faro web URL:
QUICKPIZZA_CONF_FARO_URL=Restart the docker-compose-cloud.yaml environment.
Send k6 results to Grafana Cloud Prometheus and visualize them with prebuilt dashboards
Just like in the local setup, we can output k6 result metrics to a Prometheus instance; in this case, it is provided by our Grafana Cloud Stack.
K6_PROMETHEUS_RW_USERNAME=USERNAME \
K6_PROMETHEUS_RW_PASSWORD=API_KEY \
K6_PROMETHEUS_RW_SERVER_URL=REMOTE_WRITE_ENDPOINT \
k6 run -o experimental-prometheus-rw script.js
For detailed instructions, refer to the k6 output guide for Grafana Cloud Prometheus.
The Dockerfile contains the setup for running QuickPizza without collecting data with the Grafana agent.
You can use the Dockerfile or build a Docker image to deploy the QuickPizza app on any cloud provider that supports Docker deployments. For simplicity, here are the Fly.io instructions:
- Authenticate using the fly CLI.
- Then, run the CLI to deploy the application and set up the internal port
3333that the server listens to.fly launch --internal-port 3333 --now
For deployments on remote servers, you need to pass the BASE_URL environment variable when running the k6 tests as follows:
k6 run -e BASE_URL=https://acmecorp.dev:3333 01.basic.jsBy default, QuickPizza stores all its data in an in-memory SQLite database. This allows for a quick start while still closely resembling a real world application. If you want to add an external database, you can set the QUICKPIZZA_DB environment variable to a supported connection string. Currently only PostgreSQL and SQLite is supported.
Example connection strings:
# a remote PostgreSQL instance
export QUICKPIZZA_DB="postgres://user:password@localhost:5432/database?sslmode=disable"
# a local sqlite3 database
export QUICKPIZZA_DB="quickpizza.db"If you want to run a test that uses xk6-disruptor, or want to experiment with distributed tracing, you will need to deploy QuickPizza to Kubernetes.
For a detailed setup instructions, see the QuickPizza Kubernetes guide.
You can introduce errors from the client side using custom headers. Below is a list of the currently supported error headers:
- x-error-record-recommendation: Triggers an error when recording a recommendation. The header value should be the error message.
- x-error-record-recommendation-percentage: Specifies the percentage chance of an error occurring when recording a recommendation, if x-error-record-recommendation is also included. The header value should be a number between 0 and 100.
- x-delay-record-recommendation: Introduces a delay when recording a recommendation. The header value should specify the delay duration and unit. Valid time units are "ns", "us" (or "µs"), "ms", "s", "m", "h", "d", "w", "y".
- x-delay-record-recommendation-percentage: Specifies the percentage chance of a delay occurring when recording a recommendation, if x-delay-record-recommendation is also included. The header value should be a number between 0 and 100.
- x-error-get-ingredients: Triggers an error when retrieving ingredients. The header value should be the error message.
- x-error-get-ingredients-percentage: Specifies the percentage chance of an error occurring when retrieving ingredients, if x-error-get-ingredients is also included. The header value should be a number between 0 and 100.
- x-delay-get-ingredients: Introduces a delay when retrieving ingredients. The header value should specify the delay duration and unit. Valid time units are "ns", "us" (or "µs"), "ms", "s", "m", "h", "d", "w", "y".
- x-delay-get-ingredients-percentage: Specifies the percentage chance of a delay occurring when retrieving ingredients, if x-delay-get-ingredients is also included. The header value should be a number between 0 and 100.
Example of header usage:
curl -X POST http://localhost:3333/api/pizza \
     -H "Content-Type: application/json" \
     -H "X-User-ID: 23423" \
     -H "x-error-record-recommendation: internal-error" \
     -H "x-error-record-recommendation-percentage: 20" \
     -d '{}'


