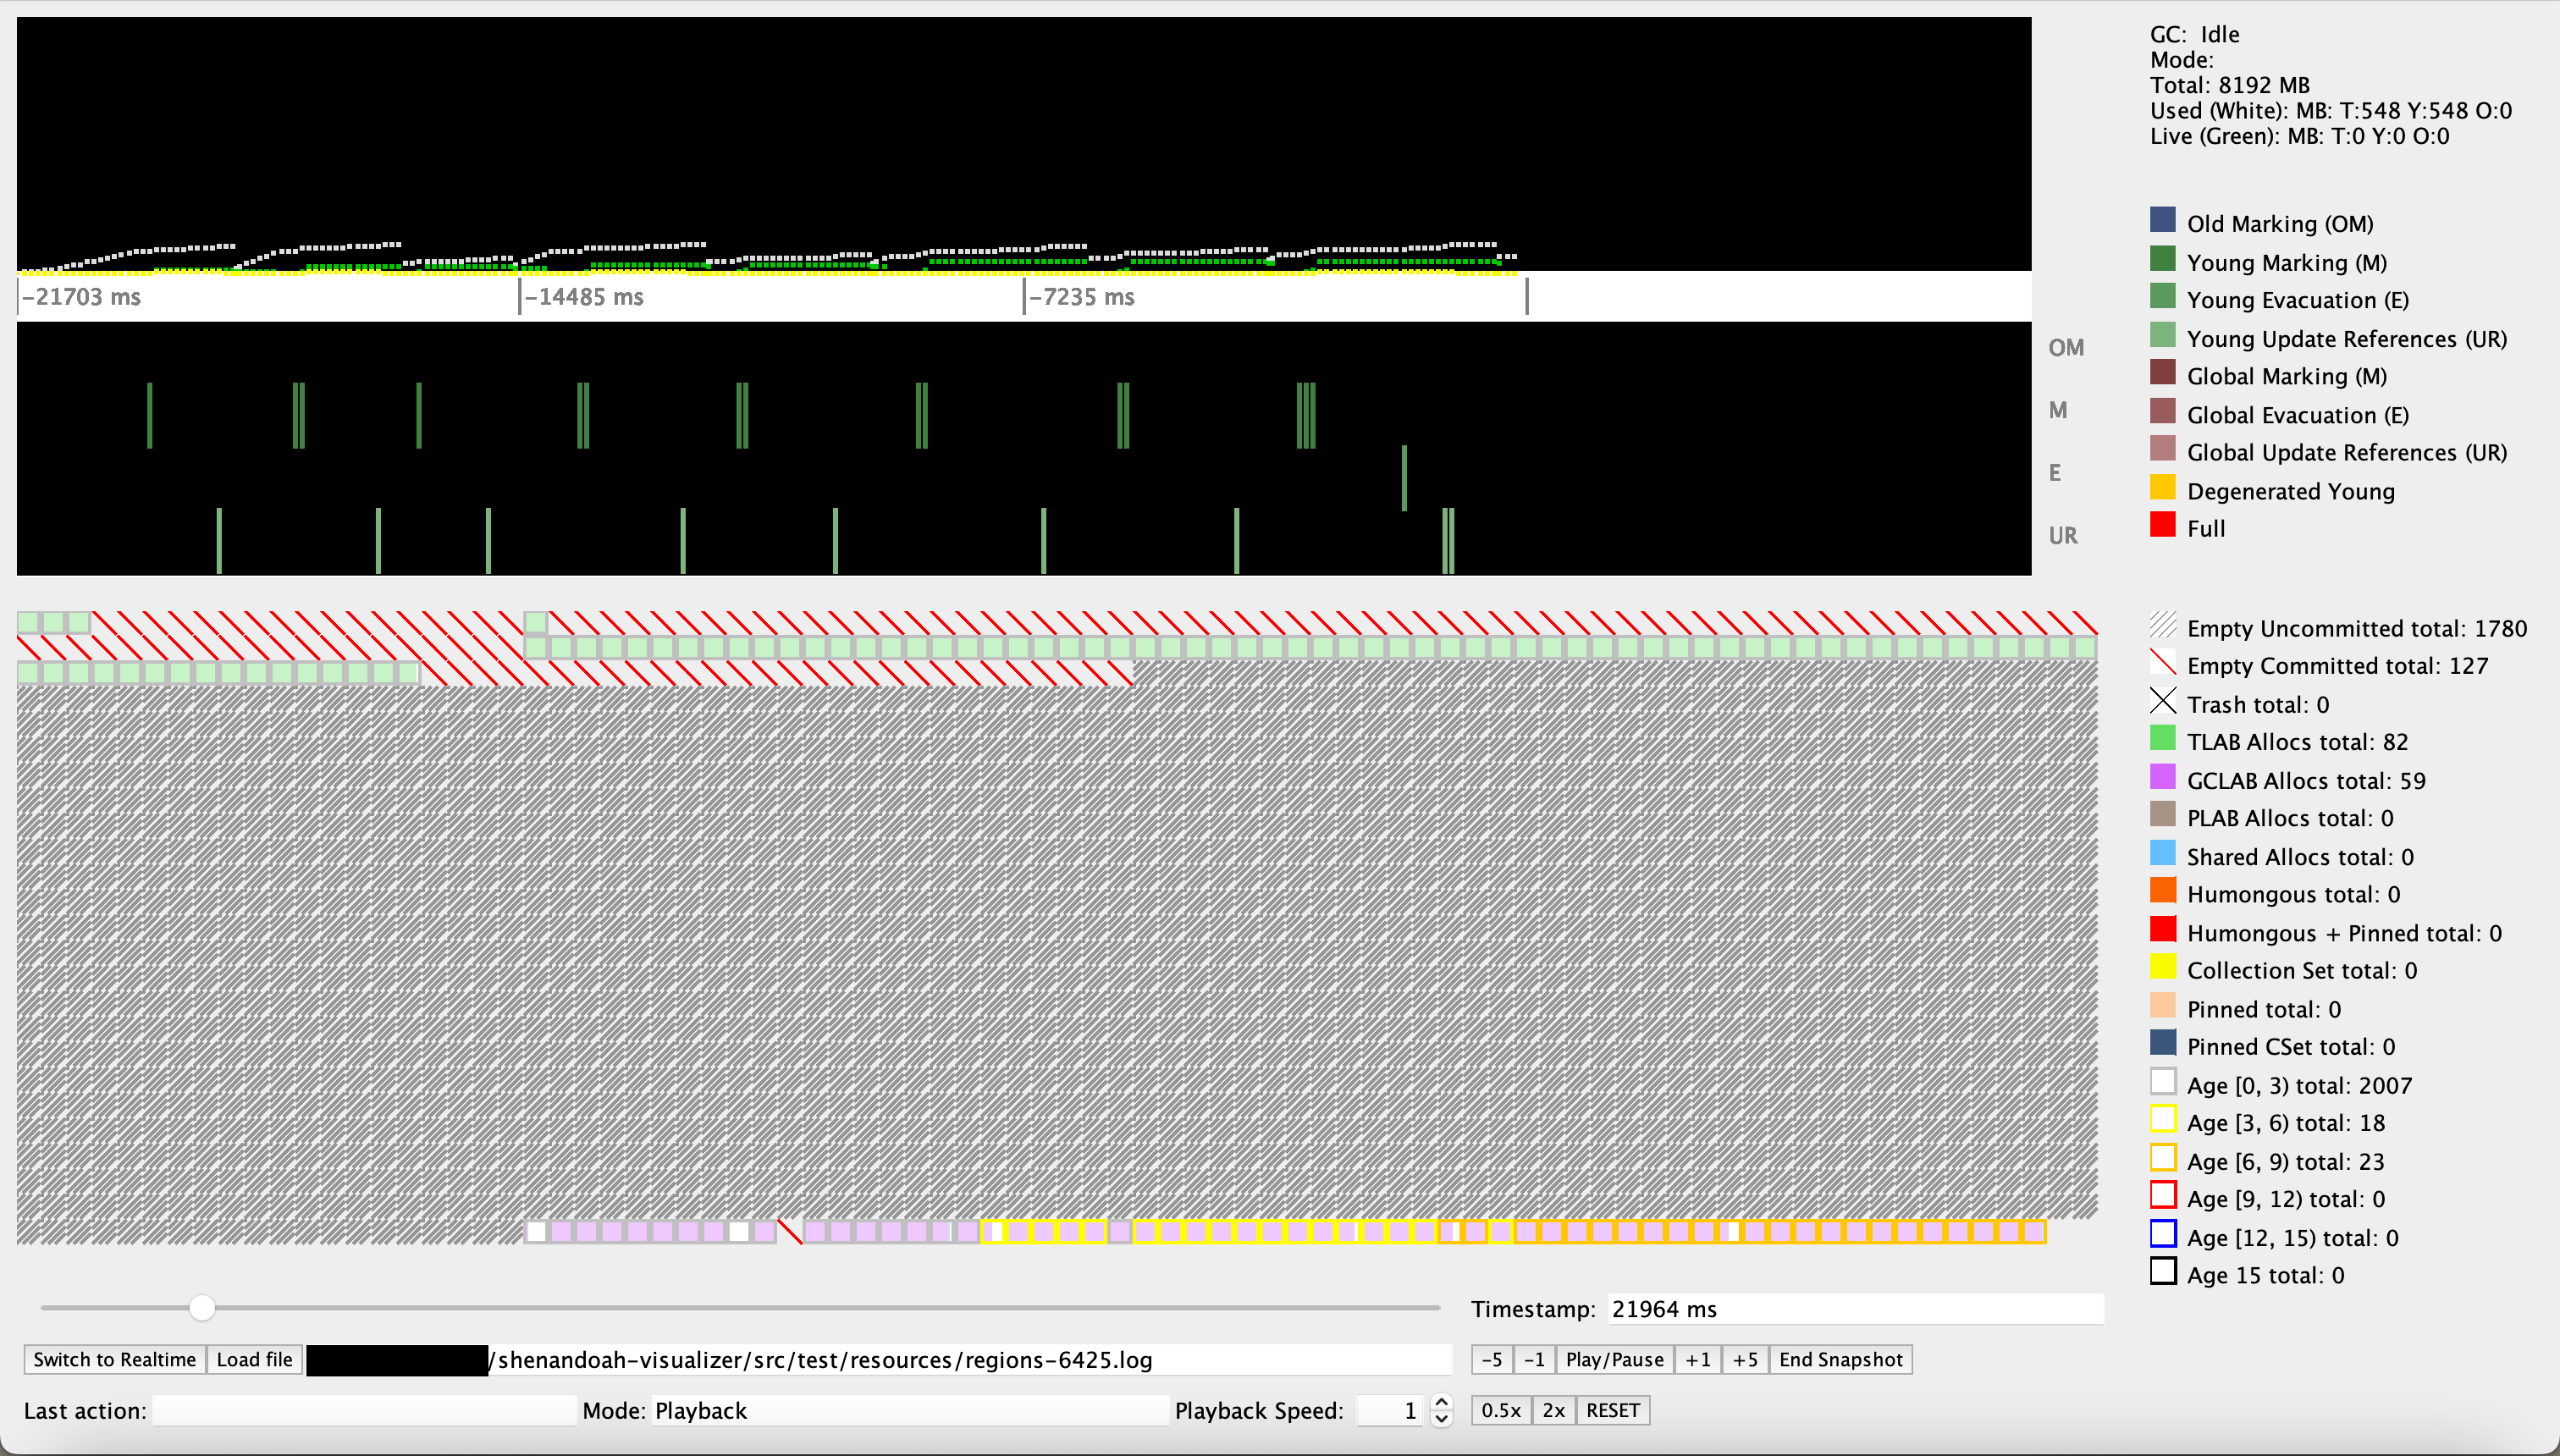
Shenandoah Visualizer is a low-level tool to visualize the internal state of Shenandoah GC. It relies on jvmstat interface to pull the data from the live JVM.
Build as any Maven-driven Java project:
$ mvn clean verify
...or pick up the binary build from here.
Step 1. Start target JVM with these additional flags:
$ java -XX:+UseShenandoahGC -XX:+UsePerfData -XX:+UnlockExperimentalVMOptions -XX:+ShenandoahRegionSampling ...
Step 2. Figure out the target JVM PID:
$ jps
Step 3a. Run the Visualizer; Visualizer will attempt to detect a JVM running Shenandoah:
$ java -jar visualizer.jar
Step 3b. Optionally attach the Visualizer using the -vm flag: If using JDK8:
$ java -Xbootclasspath/p:<path-to-tools.jar> -jar visualizer.jar -vm local://<pid>
tools.jar can usually be found at $JAVA_HOME/lib
If using JDK17+
$ java --add-exports jdk.internal.jvmstat/sun.jvmstat.monitor=ALL-UNNAMED -jar visualizer.jarNote that if you are using Intellij, you can also add these exports to the compiler (settings->javac) so that you can build and debug within the IDE.
Add this additional flag to an active JVM running Shenandoah:
$ -Xlog:gc+region=debug:<file name>::filesize=<Target byte size for log rotation>,filecount=<Number of files to keep in rotation>
Step 1. Run the Visualizer using the -logFile flag:
$ java -jar visualizer.jar -logFile <file path>
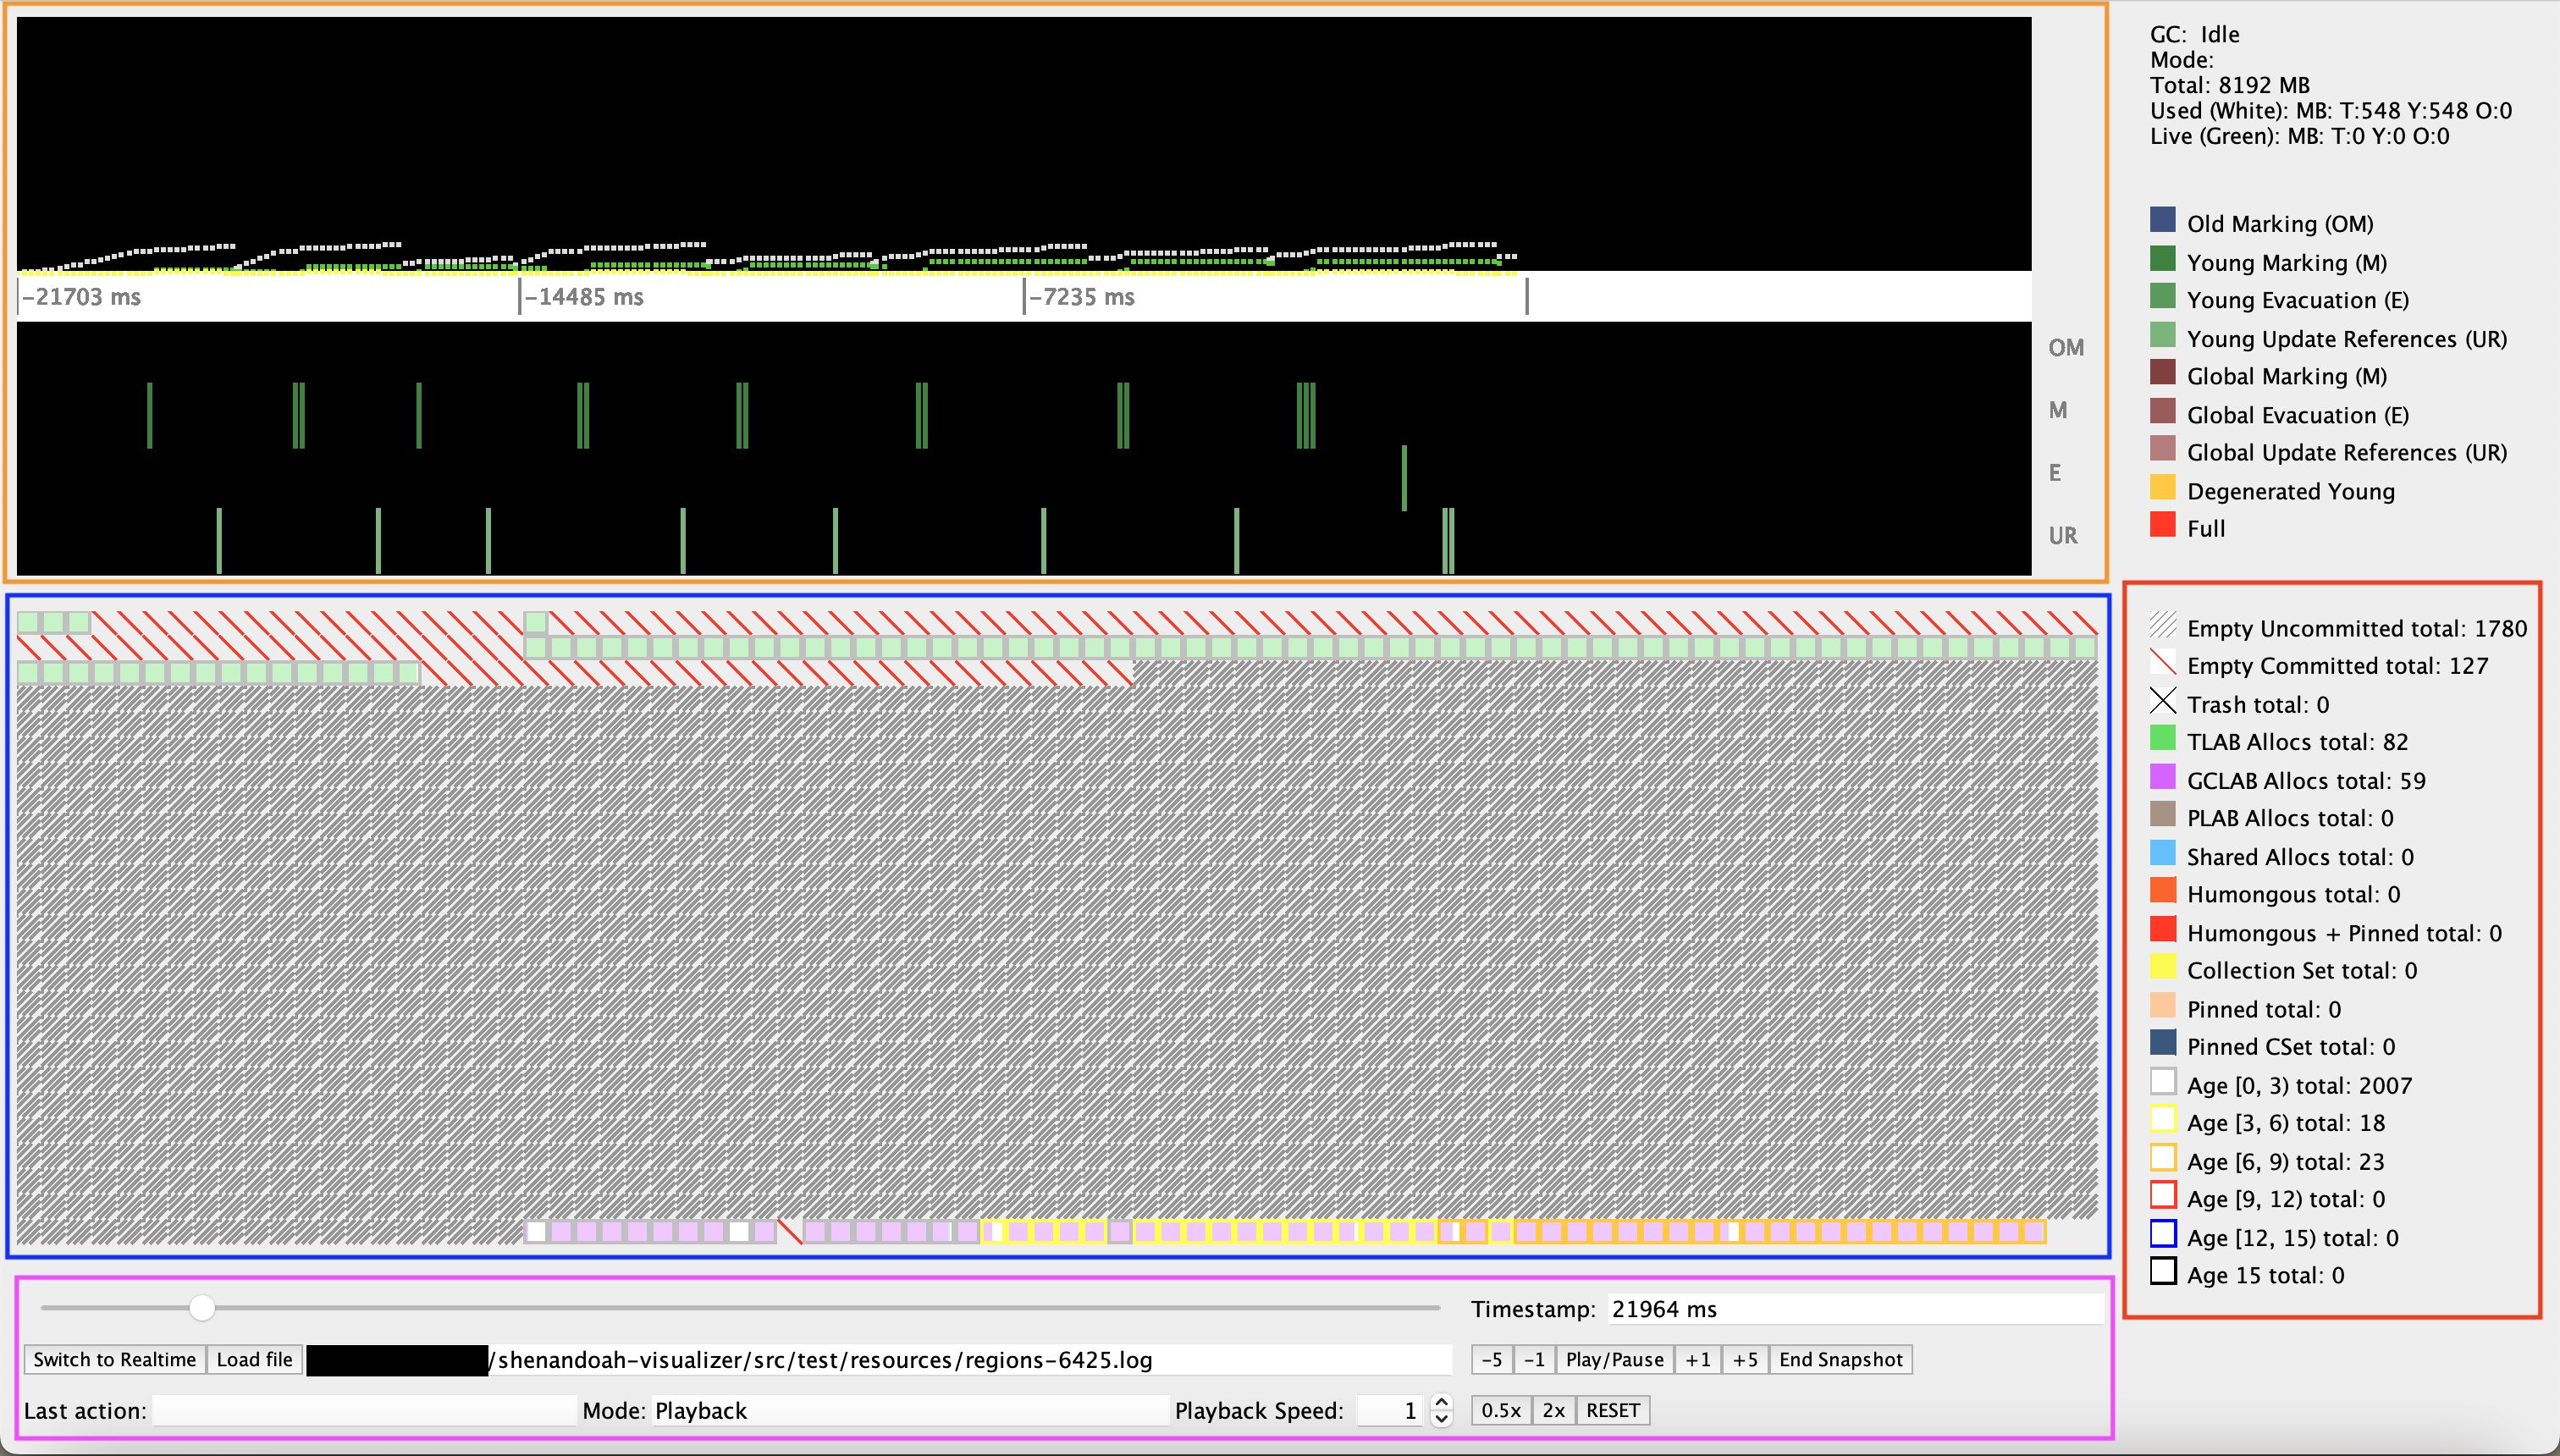
- Graph (Orange box on the top): different displacements for different collector phases and a new timescale
- Region (Blue box in the middle): generates popup window with detailed information of chosen region and historical timeline of the states for that region
- Toolbar (Pink box in the bottom): buttons and slider to control the timeline and speed for the replay mode with keyboard shortcut
space bar: play/pauseup:+5snapshotsdown:-5snapshotsleft:-1snapshotright:+1snapshotenter: reaches the last snapshot of the replay
- Summary view (Red box on the right): provides the total number of regions in each state
Sample region popup window view


