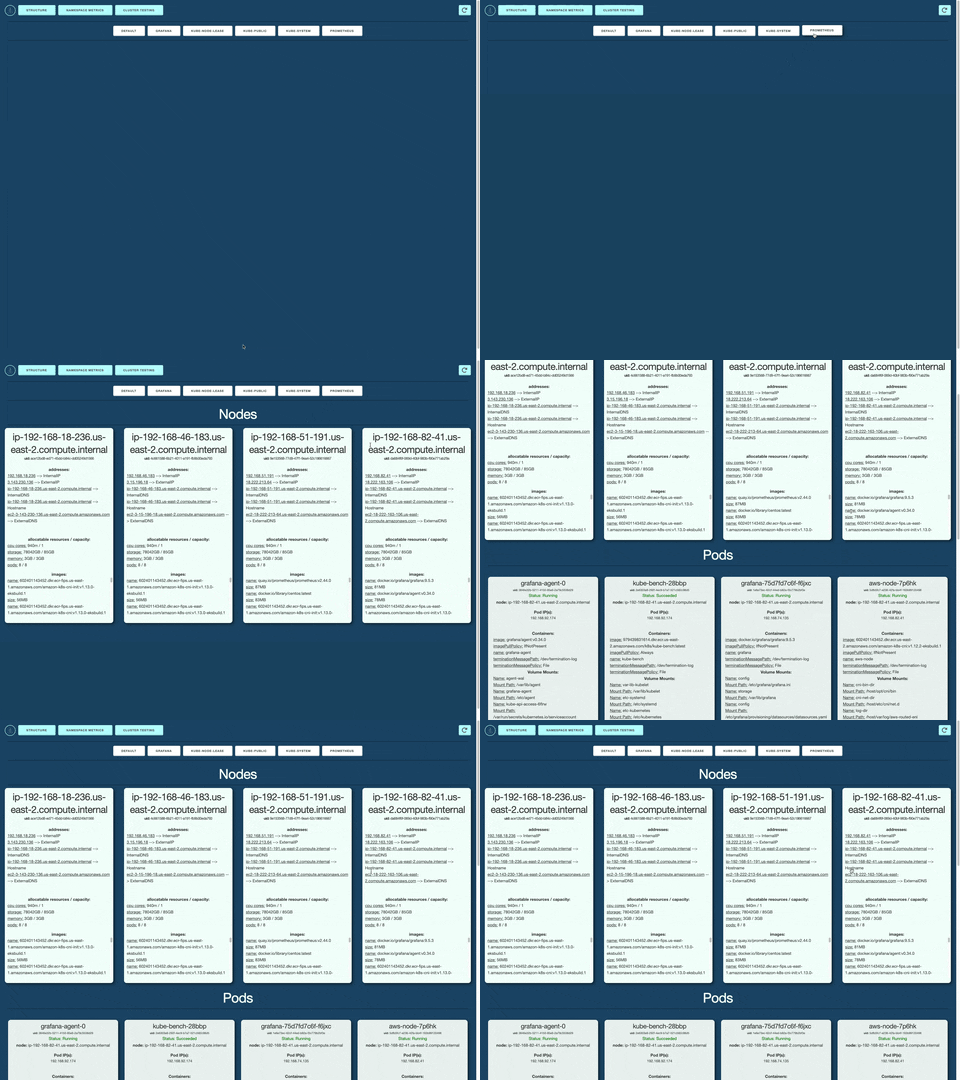
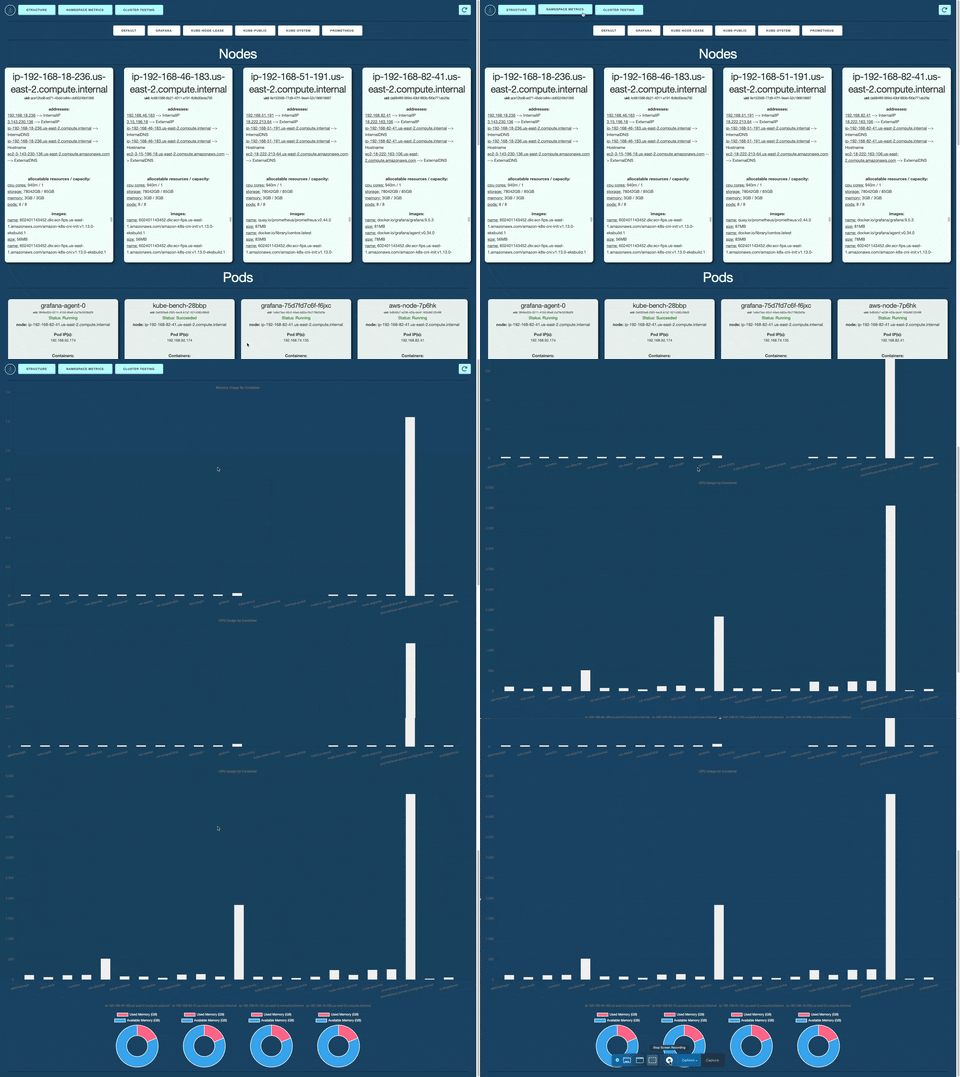
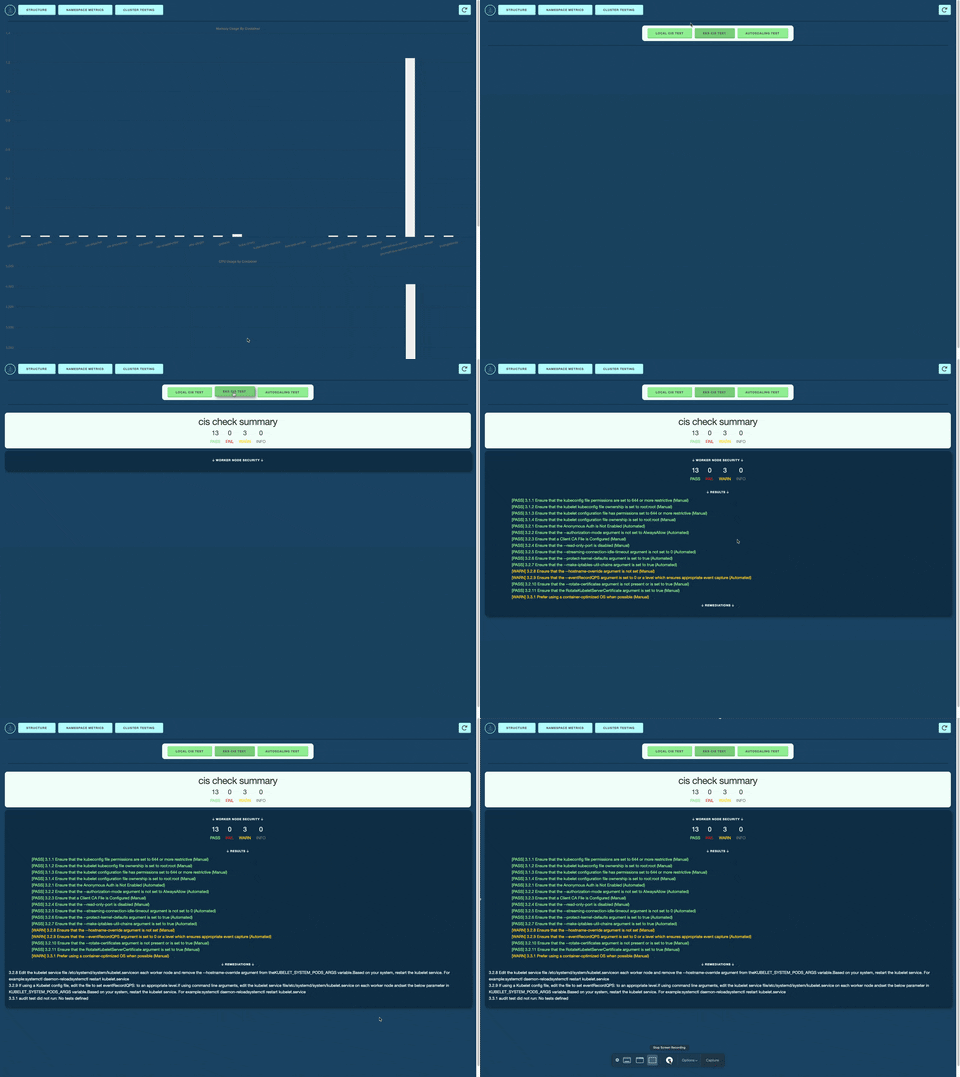
Brizo is a lightweight developer tool built from scratch to help developers monitor their Kubernetes (K8) clusters. Prometheus and ChartJS work together to monitor and display important cluster health metrics for a K8s cluster. Brizo also runs your cluster through CIS security testing standards to ensure proper cluster security.
Brizo offers several key features that make it a valuable tool for kubernetes cluster management:
-
K8s Cluster Structure Display: Brizo automatically generates a visual display of your K8s cluster structure, saving you the effort of tracking your cluster manually in the terminal. Navigate between namespaces with ease to see your deployed Nodes and PODs.
-
Compatibility with Multiple Environments: Brizo is compatible with multiple developer environments, including macOS, Windows, and Linux. Instructions based on your dev environment can be found in the Installation section.
-
Security Testing: Brizo compares your cluster configuration to the CIS security standards, ensuring proper setup for developers. Brizo also offers remediations to address any of the test warnings/failures.
-
Autoscale Testing: Brizo works with Grafana Cloud k6 services to artificially create traffic spikes and monitor your cluster's responsiveness, which helps developers identify potential bottlenecks in their cluster configuration during the development phase.
By using Brizo, developers can enjoy numerous benefits, such as:
-
Streamlined Cluster Testing: Brizo automates the security benchmarking of your cluster.
-
Improved Cluster Structure for Autoscaling: Brizo helps developers identify potential bottlenecks in their K8s cluster, which helps improve autoscaling capabilities.
-
Intuitive Dashboards: Brizo offers easy to read, live data charts to visually represent important cluster metrics scraped by Prometheus.
Brizo scrapes your K8s cluster for the purpose of displaying metrics and running CIS security protocol benchmark tests. The application does not extract or store any personal data from users. However, as a precaution, developers should avoid using sensitive information when generating clusters. This ensures that no sensitive data is inadvertently recorded or stored in the database.
-
Ensure you have the required prerequisites installed:
-
Fork the Brizo repository to your own GitHub account.
-
Clone your forked repository to your local machine.
git clone https://github.com/<YOUR-GITHUB-USERNAME>/brizo.git- Navigate to the root project directory and install dependencies.
cd brizo
npm install- Create an EKS Cluster
- Make sure your instance matches cpu architecture
- Set up AWS CLI
- Connect Prometheus
- Expose the Prometheus service:
kubectl --namespace=prometheus port-forward deploy/prometheus-server 9090
- Connect Grafana
- Expose the Grafana service:
kubectl port-forward -n grafana svc/grafana 30381:80
- Build the Kube-Bench Job
- Create a Minkube Cluster
- Install Helm
- Create a Prometheus service with Helm
helm repo add prometheus-community https://prometheus-community.github.io/helm-chartshelm repo updatehelm install prometheus prometheus-community/prometheuskubectl expose service prometheus-server --type=NodePort --target-port=9090 --name=prometheus-server-extminikube service prometheus-server-ext
- Create a Grafana service with Helm
helm repo add grafana https://grafana.github.io/helm-chartshelm repo updatehelm install grafana grafana/grafanakubectl expose service grafana --type=NodePort --target-port=3000 --name=grafana-extminikube service grafana-ext
- Get username and password for Grafana login
kubectl get secret --namespace default grafana -o jsonpath="{.data.admin-password}" | base64 --decode ; echo
aws ecr create-repository --repository-name k8s/kube-bench --image-tag-mutability MUTABLE
git clone https://github.com/aquasecurity/kube-bench.gitcd kube-benchaws ecr get-login-password --region <YOUR_AWS_REGION> | docker login --username AWS --password-stdin <YOUR_AWS_ACCOUNT_ID>.dkr.ecr.<YOUR_AWS_REGION>.amazonaws.comdocker build -t kube-bench kube-benchdocker tag kube-bench:latest <YOUR_AWS_ACCOUNT_ID>.dkr.ecr.<YOUR_AWS_REGION>.amazonaws.com/k8s/kube-bench:latestdocker push <YOUR_AWS_ACCOUNT_ID>.dkr.ecr.<YOUR_AWS_REGION>.amazonaws.com/k8s/kube-bench:latesteksctl create iamidentitymapping --cluster <YOUR_EKS_CLUSTER_NAME> --region=<YOUR_AWS_REGION> --arn arn:aws:iam::<YOUR_AWS_ACCOUNT_ID>:user/<YOUR_IAM_USERNAME> --group system:masters --username admin
Below are descriptions of each npm script:
npm run dev: Starts the development server using Nodemon
|____assets
| |____brizo-high-resolution-color-logo.png
| |____Team
| | |____Anna.png
| | |____Cortland.png
| | |____DAWG.png
| | |____Owen.png
| | |____Weston.png
|____kbcommands.md
|____output.txt
|____.eslintrc.json
|____functions.ts
|____src
| |____server
| | |____routers
| | | |____apiRouter.ts
| | | |____securityRouter.ts
| | | |____clusterRouter.ts
| | | |____prometheusRouter.ts
| | | |____k6Router.ts
| | |____controllers
| | | |____k6Controller.ts
| | | |____securityController.ts
| | | |____clusterController.ts
| | | |____prometheusController.ts
| | |____server.ts
| |____client
| | |____index.tsx
| | |____App.tsx
| | |____index.html
| | |____css
| | | |____main.scss
| | | |____skeleton.css
| | | |____normalize.css
| | |____components
| | | |____MemoryUsageChart.tsx
| | | |____ViewNamespace.tsx
| | | |____GrandCISResults.tsx
| | | |____ViewStructure.tsx
| | | |____PodCard.tsx
| | | |____NavbarComponent.tsx
| | | |____NodeCard.tsx
| | | |____MainContainer.tsx
| | | |____StaticPromComponent.tsx
| | | |____CpuUsageChart.tsx
| | | |____ViewCluster.tsx
| | | |____DynamicPromComponent.tsx
| | | |____Loading.tsx
| | | |____CISConfigResult.tsx

|
Cortland Young GitHub |

|
Owen Hill GitHub |

|
Jimmy Tran GitHub |

|
Weston Schott GitHub |

|
Anna Yu GitHub |
This project is licensed under the terms of the MIT LICENSE.


