This project delves into the intricacies of bank data from Italy to ascertain the portfolio default rate, offering enhanced predictions for the one-year probability of default (PD) among prospective borrowers.
Clone this repository and execute app.py to run the model as a local application.
For predictions regarding the probability of default, run harness.py in your Python environment.
The val.ipynb Jupyter notebook comprehensively covers data cleansing, Exploratory Data Analysis (EDA), and the model training process. Additionally, the XGBoost model checkpoint is provided as turquoise_model.bin.
As a segment of the Applied ML in Finance course at CDS NYU and NYU Stern, this project is encapsulated in Turquoise_PitchDeck.pdf, which details every phase of the project.
Our methodology encompasses a series of critical steps:
- Employing various financial ratios for data cleansing and imputation, elaborated in the accompanying write-up.
- Setting the fiscal year from July to June to preemptively address any future-peeking concerns.
- Conducting thorough sanity checks to rectify any data anomalies arising from accounting discrepancies.
- Segmenting key financial ratios into categories: liquidity, profitability, debt coverage, and asset management for in-depth analysis.
- Utilizing Variance Inflation Factor (ViF) and Correlation analysis for both univariate and multivariate examinations to mitigate multicollinearity among independent variables.
- Crafting both a logit model and an XGB model, refined through walk-forward analysis.
- Implementing transcendental transformations on the independent feature set to align the logit model more closely with the robust XGB model, enhancing explainability.
- Benchmarking the outcomes against the Altman Z-Score for a comprehensive evaluation.
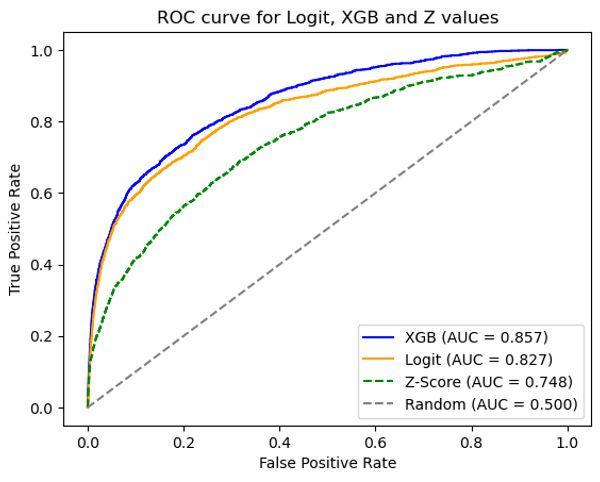
Our findings are encapsulated in the visual below and the subsequent table:
| Model | AUC Score |
|---|---|
| Logit | 0.827 |
| XGBoost | 0.857 |
| Z-Score | 0.748 |
Additional insights include:
- Calibration adjustments to align with real-world probability metrics.
- Emphasis on model explainability, leveraging statistical models for Logit and assessing weight, gain, and cover importance in the XGB model.
- Counterfactual analysis to understand the "what-if" scenarios and perform sensitivity analysis on the independent features.
