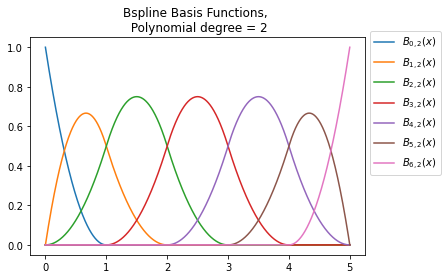
This code implements and visualises the B-splines basis functions. We implement these functions from scratch.
- numpy 1.20.1
- Matplotlib 3.3.4
I found the following links helpful:
- https://en.wikipedia.org/wiki/De_Boor%27s_algorithm
- https://cran.r-project.org/web/packages/crs/vignettes/spline_primer.pdf
To compute the B-spline bases, we need to specify:
- The degree of the polynomial,
- the vector of knot points,
- a vector containing the observations (x) for plotting the functions.
The resulting number of basis functions is given by = (# of knot points) - (degree of polynomial + 1)
spline_degree1 = 3
knots1 = [0,1/4,2/4,3/4,1]
x_list1 = np.linspace(0,0.99999,1000)

plots1 = Bsplines_plots(x_list1, knots1, spline_degree=spline_degree1)

plots1.plot_bases()
spline_degree2 = 2
knots2 = [0,1,2,3,4,5]
x_list2 = np.linspace(0,4.99999,1000)

plots1 = Bsplines_plots(x_list2, knots2, spline_degree=spline_degree2)

plots2.plot_bases()

