ServiceExplorer is a command line tool to help developers get information about our microservices and their relationship through integration events rendered as dependency graph.
With the tool installed, type:
ServiceExplorer.CommandLine --helpYou should see some information about the tool, like its current installed version and available commands.
To start using the tool you need to clone the Mapiq-One repository to your machine. With the repository cloned, for instance inside the folder c:\Mapiq, run the commands below:
ServiceExplorer.CommandLine config --add-folder C:\Mapiq\Mapiq-One\Now type the command below:
ServiceExplorer.CommandLine service --show-raising-event --show-listening-event --ignore-service-without-event --ignore-not-listened-eventYou should see a list of services and their integration events (raising and listening) being listed on the terminal.
Now type the same command you've used above, but just add the option --plot:
ServiceExplorer.CommandLine service --show-raising-event --show-listening-event --ignore-service-without-event --ignore-not-listened-event --plotYou should see an image (SVG) opened on your browser showing all services and events that are raised and listened.
For more detailed information about the commands available, read the next sections.
ServiceExplorer.CommandLine config --helpBefore starting to use the ServiceExplorer, we need to add the folder for Mapiq-One.
If you don't have these repositories cloned in your machine, please clone them now.
In this example, I'm assuming that you've cloned the two folders inside the folder c:\Mapiq.
ServiceExplorer.CommandLine config --add-folder C:\Mapiq\Mapiq-One\If you've added a wrong folder, you can use the command bellow to remove it from the configuration.
ServiceExplorer.CommandLine.exe config --remove-folder C:\Mapiq\Wrong-Folder\ServiceExplorer.CommandLine.exe service --helpServiceExplorer.CommandLine.exe serviceServiceExplorer.CommandLine.exe service --show-raising-eventServiceExplorer.CommandLine.exe service --show-listening-eventServiceExplorer.CommandLine.exe service --show-raising-event --show-listening-eventShow all services and events raised and listened by them, ignoring services without event and events that are not listened by any other service
ServiceExplorer.CommandLine.exe service --show-raising-event --show-listening-event --ignore-service-without-event --ignore-not-listened-eventFor any combination of arguments/options used with the Service command you can use the option --plot, then instead of writing the output to a terminal a chart will be plotted.
If you run the previous command, but add the --plot option, a chart like this will be generated:
ServiceExplorer.CommandLine.exe service --show-raising-event --show-listening-event --ignore-service-without-event --ignore-not-listened-event --plotYou can filter the services that will appear in the result by using the --filter-service option.
This option can be used multiple times to filter multiple services.
Using the same command used in the Plotting section but adding a filter for Office Shifts service and Building service you will have a chart showing only the services and events of that context and you can easly see how is the relationship of these services in regard to integration events.
ServiceExplorer.CommandLine.exe service --show-raising-event --show-listening-event --ignore-service-without-event --ignore-not-listened-event --filter-service shifts --filter-service building --plotServiceExplorer.CommandLine.exe event --helpServiceExplorer.CommandLine.exe eventServiceExplorer.CommandLine.exe event --show-service-raisingServiceExplorer.CommandLine.exe event --show-service-listeningServiceExplorer.CommandLine.exe event --show-service-raising --show-service-listeningServiceExplorer.CommandLine.exe event --show-service-raising --show-service-listening --ignore-not-listened-eventFor any combination of arguments/options used with the Event command you can use the option --plot, then instead of writing the output to a terminal a chart will be plotted.
If you run the previous command, but add the --plot option, a chart like this will be generated:
ServiceExplorer.CommandLine.exe event --show-service-raising --show-service-listening --ignore-not-listened-event --plotYou can filter the events that will appear in the result by using the --filter-event option.
This option can be used multiple times to filter multiple events.
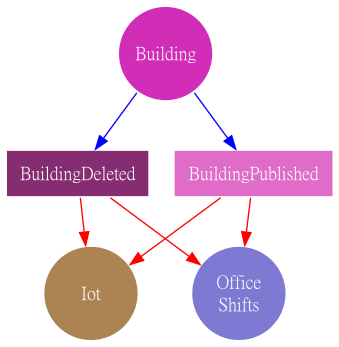
Using the same command used in the Plotting section but adding filter for BuildingDeleted and BuildingPublished events you will have a chart showing only the events and services of that context and you can easily see how is the relationship of these events with the services.
ServiceExplorer.CommandLine.exe event --show-service-raising --show-service-listening --ignore-not-listened-event --filter-event BuildingDeleted --filter-event BuildingPublished --plot


