The original algorithm is implemented in R by Suzuki and Shimodira (2006): Pvclust: an R package for assessing the uncertainty in hierarchical clustering. This is its Python reimplementation. The final values produced are Approximately Unbiased p-value (AU) and Bootstrap Probability (BP) which are reporting the significance of each cluster in clustering structure. The AU value is less biased and clusters that have this value greater than 95% are considered significant. Both values are calculated using Multiscale Bootstrap Resampling.
This implementation is part of the Master Thesis at the Faculty of Computer and Information Science, University of Ljubljana.
Here, we will show exmple of usage of the Python implemention on the Boston Housing dataset.
import pandas as pd
from sklearn.datasets import load_boston
from pvclust import PvClust

if __name__ == "__main__":
    X, y = load_boston(return_X_y=True)
    X = pd.DataFrame(X)
    pv = PvClust(X, method="ward", metric="euclidean", nboot=1000)
While aglorithm is running we follow its stages.
To display the obtained dendrogram with p-values we call pv.plot().
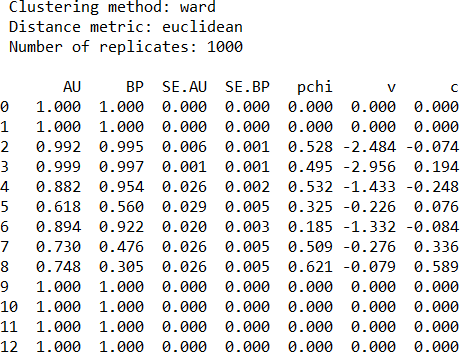
To display result we call function print_result.
pv.print_result()Furthermore, if we are interested in specific clusters or want to display values with certain decimal points we can call following:
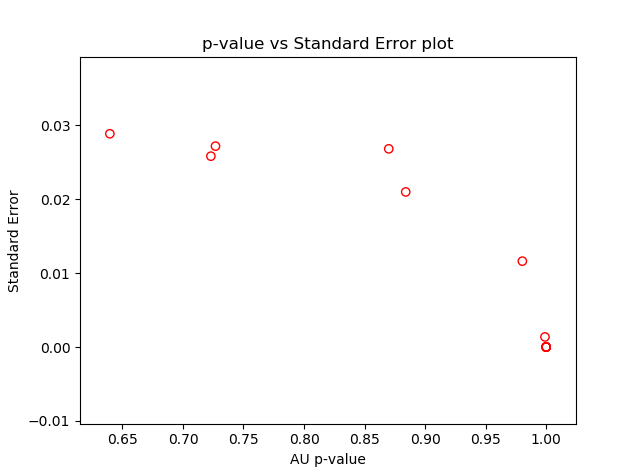
pv.print_result(which=[2, 6], digits=5)The standard errors of AU p-values can be displayed on a graph by calling function seplot.
pv.seplot()We also implemented parallel version of this implementation which can run by setting the parallel=True. In this mode, the algorithm will deploy all the cores on the machine and speed up the calculation.
from sklearn.datasets import load_boston
from pvclust import PvClust

if __name__ == "__main__":
    X, y = load_boston(return_X_y=True)
    X = pd.DataFrame(X)
    pv = PvClust(X, method='ward', metric='euclidean', nboot=1000 , parallel=True)


