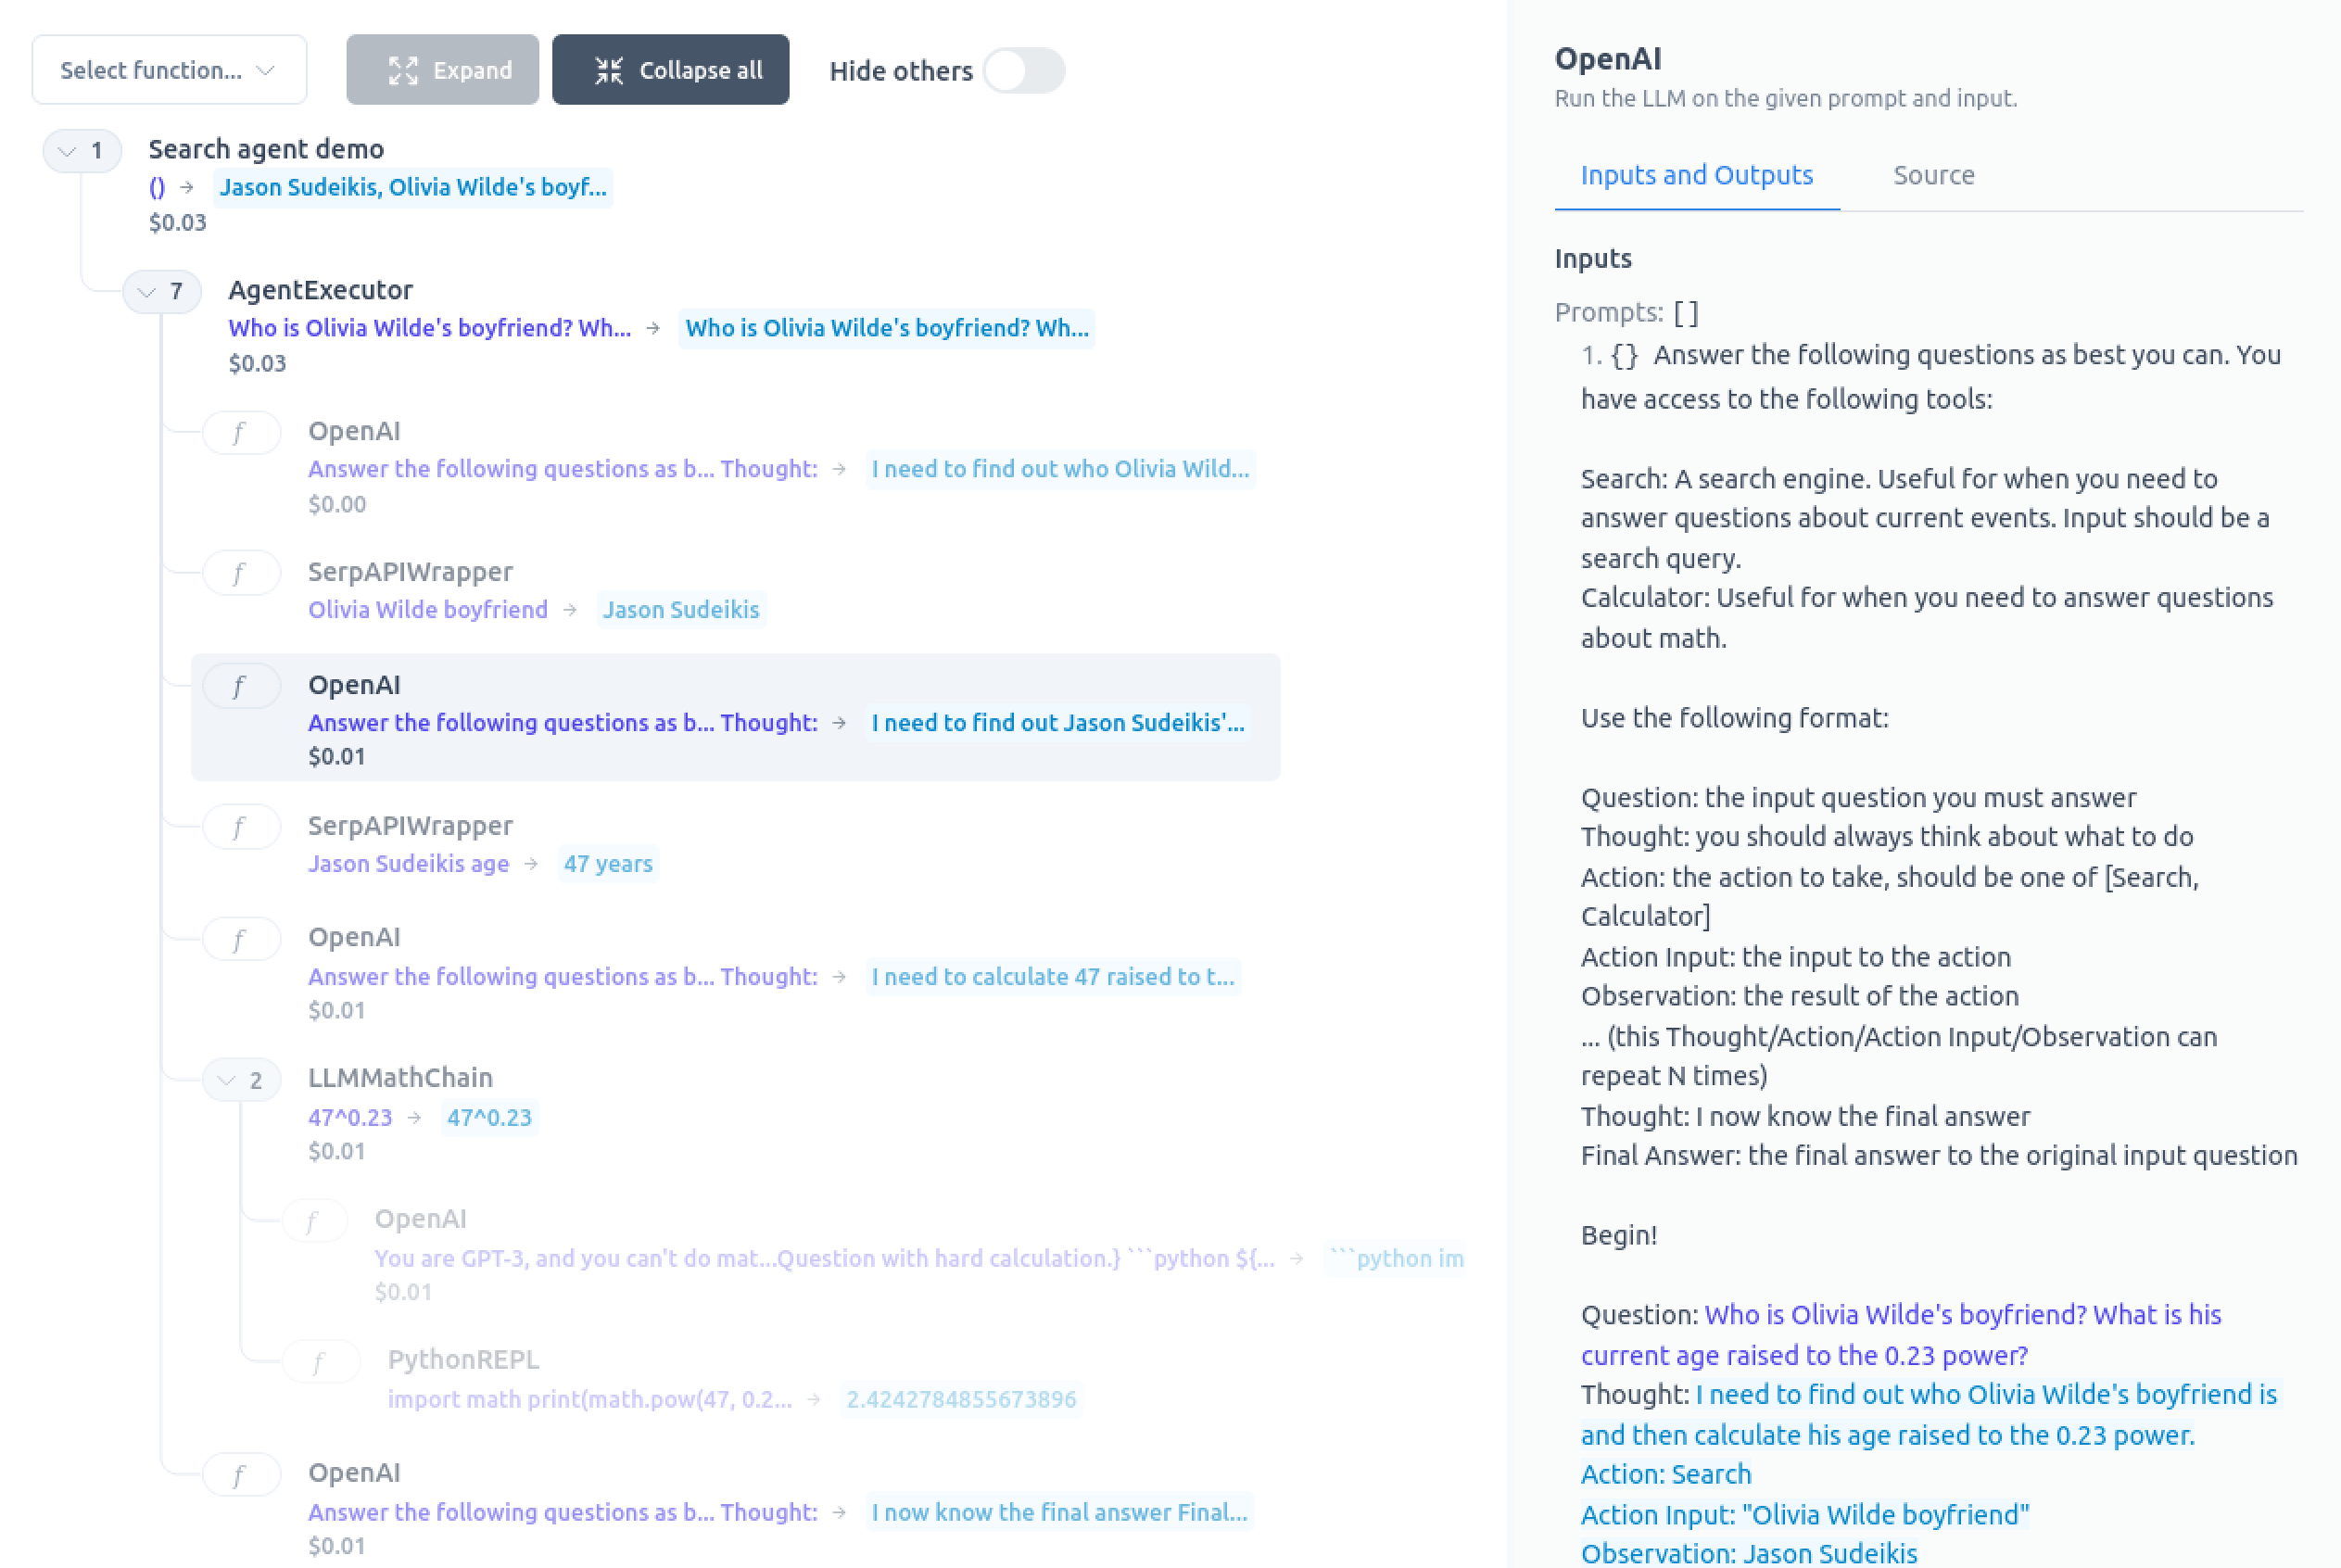
Adapts Ought's ICE visualizer for use with LangChain so that you can view LangChain interactions with a beautiful UI.
You can now
- See the full prompt text being sent with every interaction with the LLM
- Tell from the coloring which parts of the prompt are hardcoded and which parts are templated substitutions
- Inspect the execution flow and observe when each function goes up the stack
- See the costs of each LLM call, and of the entire run, if you are using OpenAI's
text-davinci-003model
Install this library:
pip install langchain-visualizerThen:
- Add
import langchain_visualizeras the first import in your Python entrypoint file - Write an async function to visualize whichever workflow you're running
- Call
langchain_visualizer.visualizeon that function
For an example, see below instructions on reproducing the screenshot.
To run the example you see in the screenshot, first install this library and optional dependencies:
pip install langchain-visualizer google-search-results openaiIf you haven't yet set up your OpenAI API keys or SERP API keys, you can replay the recorded interactions by cloning this repository and running
$ pip install vcr-langchain
$ OPENAI_API_KEY=dummy python tests/agents/test_langchain_getting_started.py
If you have set them up, you can run the following script (adapted from LangChain docs):
import langchain_visualizer
import asyncio
from langchain.agents import initialize_agent, load_tools
from langchain.llms import OpenAI

llm = OpenAI(temperature=0.7)
tools = load_tools(["serpapi", "llm-math"], llm=llm)
agent = initialize_agent(tools, llm, agent="zero-shot-react-description", verbose=True)
async def search_agent_demo():
    return agent.run(
        "Who is Olivia Wilde's boyfriend? What is his current age raised to the 0.23 "
        "power?"
    )

langchain_visualizer.visualize(search_agent_demo)
A browser window will open up, and you can actually see the agent execute happen in real-time!
Jupyter notebooks are now supported! To use this inside a Jupyter notebook, make sure to import the visualize function from langchain_visualizer.jupyter instead.
Please look at the demo notebook to see an example of how it can be used in Jupyter.
If you want to also visualize documents being chunked up for embeddings, you can now do so by calling the visualize_embeddings function before you visualize the main chain:
from langchain_visualizer import visualize, visualize_embeddings

async def run_chain():
    ...

visualize_embeddings()
visualize(run_chain)For me personally:
- I prefer the ICE UI. In particular:
- I like the colored highlighting of parts of the prompt that are filled-in template variables
- I like the ability to quickly inspect different LLM calls without leaving the trace page
- I prefer the visualization of my agent logic to remain static when LLM calls are cached
- I prefer seeing when the tool (e.g.
PythonREPL) actually gets called, rather than just the high-level execution of the chain (e.g.LLMMathChain)
That being said, LangChain's tracer is definitely better supported. Please note that there is a lot of langchain functionality that I haven't gotten around to hijacking for visualization. If there's anything you need to show up in the execution trace, please open a PR or issue.
Please check out VCR LangChain, a library that lets you record LLM interactions for your tests and demos!
