The Branch Monitoring Project.
Branch Monitor is an alternative for runtime process monitoring on modern (Windows) systems. Our approach makes use of Branch Trace Store (BTS) from Intel's processors to implement a dynamic, transparent framework. The framework provide many analysis facilities, such as function call tracing and Control Flow Graph (CFG) reconstruction.
This project is part of Marcus Botacin's master work. Marcus is a Computer Science master candidate at Institute of Computing from University of Campinas, being advised by Prof. Dr. Paulo Lício de Geus and Prof. Dr. André Ricardo Abed Grégio. More detailed information, such as academic papers, can be found at the project page.
From code to real world.
The repository is organized as follows:
- Client: A simple polling-based driver client able to retrieve and print branch-collected data.
- BranchClient: An advanced driver client able to perform flow analysis and CG, CFG reconstruction for a given Process ID (PID). You are required to provide addresses for all libraries to be monitored.
- Branch.Tester: A loop program used for validation purposes.
- Launcher: A tool to ease monitoring process start up. Given a PID, dumps all memory address and supplies them as inputs to the advanced client.
- BranchMonitor.NMI: The monitoring driver (NMI handler).
- BranchMonitor.PMI: The monitoring driver (PMI handler).
- BranchMonitor.Multi-core: The monitoring driver in a multi-core version (PMI handler).
- BranchMonitor.Multi-paeg: The monitoring driver in a multi-page collection version (PMI handler).
- DumpDLL: A tool to ease introspection headers generation.
- Kernel: Kernel introspection modules.
- Misbehavior.Detection: A profiling tool to detect application misbehavior.
- Transparency.Tests: Tools to attest BranchMonitor's transparency.
- ROP: CFI verification tools to be used on execution traces.
- Debugger: A debugger built upon BranchMonitor framework.
- Utils: General utils for binary analysis using BranchMonitor.
- PIN.Branch.Monitor: A DBT-Based branch monitor implementation, used for comparative purposes.
Currently, the BranchMonitor driver is available on two versions. The first is implemented using an NMI callback to handle interrupts whereas the second is implemented by hooking the performance handler to do so.
- Compiled on Visual Studio 2012.
- Binaries may require MSVCR110D.dll when compiled using debugging symbols.
- The simple client requires Python and win32file.
- The advanced client requires .Net framework.
- Code disassembly is performed by Capstone.
- Automatic launcher requires Python, Sysinternals, BeautifulSoup, Codecs, and ConfigParser.
- DLL dumps for DumpDLL are obtained using DLL Export Viewer.
- The traces inputed to the Divergence.Analysis tool are aligned using the Alignment library.
Some configurations, such as monitoring core, should be set on the config.h file.
You should define wether you want debug messages to be displayed or not.
#define DEBUGIn this case, you are also required to define the driver name printed on debugger screen. This step is important so that you can filter driver messages being displayed.
#define DRIVER_NAME "[BRANCH-MONITOR]"You also should set driver name for system and DOS subsystem. This is the name you use to communicate using OpenFile.
#define DRIVERNAME L"\\Device\\BranchMonitor"
#define DOSDRIVERNAME L"\\DosDevices\\BranchMonitor"
You should set on which core the monitor will be enabled.
#define BTS_CORE 3Introspection Update: As noticed by @smaresca, introspection headers are version-dependent. The values supplied work for Windows 8 x64 6.2 build 9200. Some DLL versions are shown below whereas others can be found on DLL.Versions.
ProductVersion   FileVersion      FileName
--------------   -----------      --------
6.2.9200.16384   6.2.9200.1638... C:\Windows\System32\ntdll.dll
6.2.9200.16384   6.2.9200.1638... C:\Windows\System32\kernel32.dll
In order to run the solution on other systems, you need to dump the target DLL and generate the header file. This process is eased by the DumpDLL tool, which parses DLL dumps and produces the correct, ordered outputs, as shown below:
NTDLL Input:
==================================================
Function Name     : ZwYieldExecution
Address           : 0x0000000180003040
Relative Address  : 0x00003040
Ordinal           : 1971 (0x7b3)
Filename          : ntdll.dll
Full Path         : C:\Windows\system32\ntdll.dll
Type              : Exported Function
==================================================
NTDLL Output:
strcpy , 4896
strcat , 4720
memcmp , 4496
_local_unwind , 4432
RtlGetCurrentUmsThread , 4240
RtlEnterCriticalSection , 4192
RtlLeaveCriticalSection , 4112
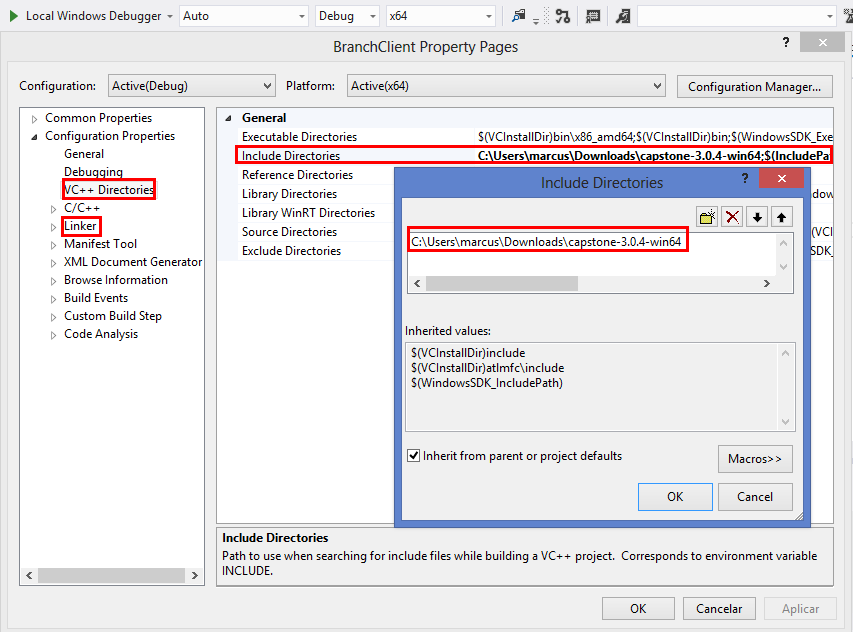
In order to build the many components of our framework, you should include their paths on the compilation project, as shown below:
In my computer, I was compiling under C:\. If you are compiling from other dir, you need to point /src path properly.
To make the BranchClient compilation easier, I included the capstone-3.0.4-win64 on the repository.
You should also define system architecture and configurations, as shown below:
All required steps for the win!
As our driver is not signed, you should disable driver sign enforcement in order to use it.
After installing it, you can load it using services manager, as shown below:
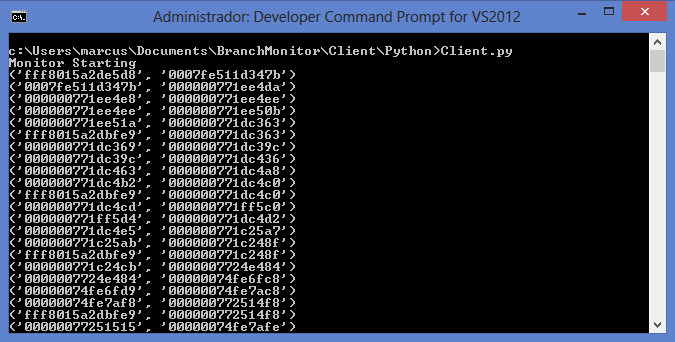
In order to check if the solution is properly working, you can use the simple client to retrieve branch data, as shown below:
In order to filter process actions and perform analysis tasks, such as disassembling, you have to start the advanced client with the binary's and libraries' address, as shown below:
In order to ease this process, the Launcher is able to perform the task of retrieving address information and launching the client, as you can see below:
After its startup, the client is already working, as shown below:
The BranchClient\examples directory contains some trace examples obtained from real malware samples. I hope they could clarify BranchMonitor's role on binary monitoring. Some identified actions are shown below:
LIB C:\Windows\SysWOW64\user32.dll at 74c68038 (GetCursorPos+0x12) returned to Binary avr.exe at 465806
LIB C:\Windows\SysWOW64\user32.dll at 76489ddc (IsWindowVisible+0x38) returned to Binary Chrome.exe at 4c52a5
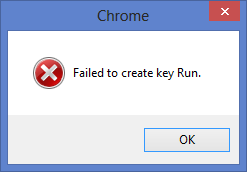
In such cases, these functions were used to display the following message:
One of biggest advantages of using BranchMonitor is the provided transparency. In order to verify such claim, you can use the checks from the Transparency.Tests directory. My intention is not to provide an exhaustive list of anti-dbg techniques, but some transparency insights instead.
Currently implemented tests:
- IsDebuggerPresent
- CheckRemoteDebugger
- OutputDebugString
For more information about anti-analysis tricks, check this.
You can check debug messages if the driver was compiled using the DEBUG flag, as shown:
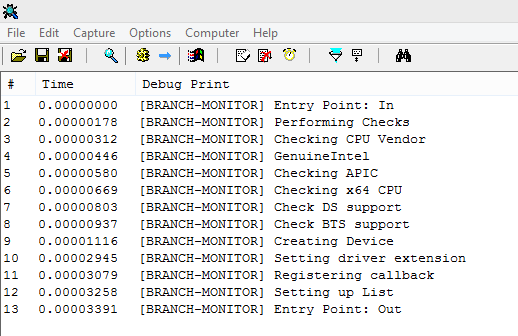
#define DEBUGThe debug messages are printed on a debug screen. The following figure shows the messages being printed on DbgView, from SysInternals.
Applications build upon the developed framework.
A debugger built upon BranchMonitor framework. The directory is organized as follows:
- GDB: A GDB stub which can be used to control the BranchMonitor debugger. On the original article, it was integrated into the debugger solution itself, but I released here an standalone version, so people can use it on distinct applications. It is totally based on mseaborn's gdb-debug-stub.
- Driver: To be released.
The GDB stub is available by setting the remote target on the GDB client, as shown below:
More information is coming soon.
As a result of BranchMonitoring framework, some Control Flow Integrity (CFI) policies for ROP attack detection were implemented. You can find on the ROP directory implementations for the CALL-RET and the Gadget-Size policies. Although I have previously described on an article a real-time solution, the hereby published tools are intended for post-analysis. However, you can easily implement these algorithms on the DriverClient, since the traces were retrieved from the tool.
The CALL-RET policy consists on matching pairs of CALLs and RETs, based on the idea of each RET must be preceed by a CALL on an integer flow. This policy is shown below:
('CURRENT STACK ', [['call', 'NewToy', 'printf']])
('CURRENT STACK ', [['call', 'NewToy', 'printf'], ['call', 'printf', '__iob_func']])
('CURRENT STACK ', [['call', 'NewToy', 'printf'], ['call', 'printf', '__iob_func'], ['ret', '__iob_func', 'printf']])
CALL-RET MATCH, REMOVING
...
('CURRENT STACK ', [['call', 'NewToy', 'printf']])
('CURRENT STACK ', [['call', 'NewToy', 'printf'], ['ret', 'printf', 'NewToy']])
CALL-RET MATCH, REMOVING
('CURRENT STACK ', [])
The gadget size policy is a heuristic which assumes ROP gadgets are smaller than ordinary ones, so a moving window is used to register the execution of a given number of small gadgets, as shown below:
('Detected in', [2, 17, 36, 4, 2, 27, 13, 5, 46, 2])
Given the transparency characteristic, our framework is able to execute anti-analysis tricks without any problem. It allows us to perform pattern matching searches for evasion attempts and other tricks. By using these detectors, I was able to detect some of them, shown below:
Fake Conditional Jump:
4001b: xor    %eax,%eax
4001d: jne    4000 <main>
4001f: pop    %rbp
CPU Comparison:
4400:   push   %rbp
4401:   str    0x0(%ebp)
4406:   mov    %rsp,%rbp
4409:   mov    $0x0,%edi
440e:   callq  44013 <main+0x13>
One can also use our transparent tracer as a groundtruth for evaluating the way a binary executes inside another tracing tool. The tool under the Utils/Divergence.Analysis is suited for this task. A divergence example is shown below:
0x01 | 0x01
0x02 | 0x02
    / \
---- | 0x41
0x03 | 0x42
    \ /
0x05 | 0x05
0x06 | 0x06
The aforementioned tricks were also detected by inspecting the instruction block placed right before a divergent branch instruction.
The Utils directory contains some tools and utilities for binary analysis using BranchMonitor. Currently, the following tools are available:
- PrintFunc: A simple script for printing the functions called on a given trace
- ManualDisasm: A pybfd-based solution for disasming small bytes.
This utility should be used as follows:
Usage: python PrintFunc.py <trace> --remove-offsets
The called functions can be printed considering or not their offsets, as shown below:
Considering Offsets:
LdrShutdownProcess+0x256
LdrShutdownProcess+0x2b7
RtlExitUserProcess+0xac
Discarding Offsets:
LdrShutdownProcess
LdrShutdownProcess
RtlExitUserProcess
You can filter the output in order to increase your analysis power. The following example shows function calls being counted.
Counting command:
python PrintFunc.py $1 $2 | sort | uniq -c | sort -gr
Command Output:
56 printf
12 WriteFile
10 TerminateThread
2 ExitProcess
A tool to disasm small pieces of code from trace-retrieved data.
Usage Example:
Usage: python ManualDisasm.py <trace> <addr>
Example Considering the following trace excerpt:
should disasm from 444417 to 444427
\x8b\x45\xf0\x3b\xc7\x74\x11\x8d\x4d\xf0\x51\x8b\x4d\x08\x48\x50
Command Example:
python ManualDisasm.py "\x8b\x45\xf0\x3b\xc7\x74\x11\x8d\x4d\xf0\x51\x8b\x4d\x08\x48\x50" 0
Command Output:
0x4 (size=1)	 pop    rsp
0x5 (size=2)	 js     0x000000000000003b
0x7 (size=5)	 xor    eax,0x3066785c
0xC (size=1)	 pop    rsp
0xD (size=2)	 js     0x0000000000000042
Always as possible, I try to compare BranchMonitor with other solutions, either for validation or evaluation. For such purpose, I present here a Dynamic Binary Translation (DBT) tool, implemented on Intel PIN. The tool directory, PIN.Branch.Monitor, is organized as follows:
- Windows: Instrumentation code to be run on Windows.
- Linux: Instrumentation code to be run on Linux.
- Comparison: Comparison results between PIN tool and BranchMonitor.
As this tool is implemented as an instrumentation code, it can be run on Linux or Windows. The small differences between the two versions are function or type names.
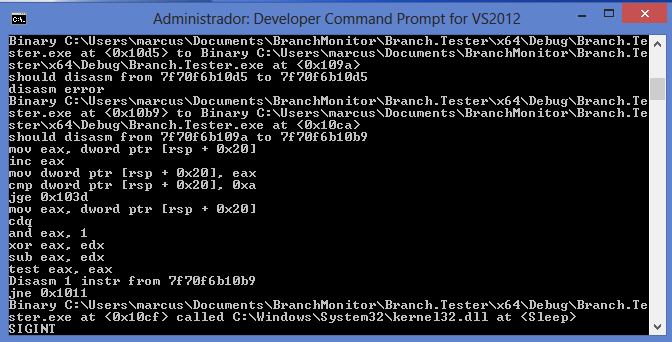
The Comparison directory presents the results from running the Branch.Tester code on BranchMonitor and the PIN tool. As can be noticed on the example above, the results are similar.
PIN Result:
From: 0000000077332F89 To: 0x7732ec90 Disasm of 1 instr: call
From: 000000007732EC97 To: 0x7732ecab Disasm of 1 instr: jnz
Disasm of 0x7 bytes from 000000007732EC90: 0x48 0x3b 0xd 0x39 0x8e 0xe 0x0
BranchMonitor Result:
Binary C:\BranchMonitoringProject\Branch.Tester\x64\Debug\Branch.Tester.exe at <0x1ca1> to Binary C:\BranchMonitoringProject\Branch.Tester\x64\Debug\Branch.Tester.exe at <0x1c90>
Binary C:\BranchMonitoringProject\Branch.Tester\x64\Debug\Branch.Tester.exe at <0x1c96> to Binary C:\BranchMonitoringProject\Branch.Tester\x64\Debug\Branch.Tester.exe at <0x1c9a>
should disasm from 7ff6d6ec1c90 to 7ff6d6ec1c96
On both cases, the same number of bytes were considered on the execution trace.
I am performing some code clean up before publishing the final solution. This way, some features are not available yet. I plan to release such features as soon as possible.
This framework is presented as a proof-of-concept (PoC) of the branch monitoring capabilities, thus some limitations exists, such as:
- Single Core Analysis: The branch mechanism should be extended to operate on multicore systems.
- I/O Limitation: Currently, I/O is performed by polling. The driver should be extended to support IOCTLs.
- Debug:
- Debug messages are currently implemented as functions. Macros should be used instead.
- Debug is enabled using #defines. A dynamic control mechanism should be implemented.
- Debug messages are printed on every function. We need verbosity control.
- CPU Checks: PERF_COUNT support check is missing.
- BranchClient Multi-Thread Support: How to launch more threads without breaking flow tracking ?
- Linux version.
I really would like to receive your contributions. By now, a non-exhaustive list of possible contributions:
- Implementing missing features: See Limitations section.
- Solving TO-DOs: Lots of improvements along the code.
- Replacing insecure functions: Remove all strcpy and shell=True from the code.
- Add new Utils: The more analysis tools the better!
My academic work related to branch monitoring.
We published an academic paper, titled Enhancing Branch Monitoring for Security Purposes: From Control Flow Integrity to Malware Analysis and Debugging, in the ACM Transactions on Privacy and Security (TOPS). It covers both theory and practice about branch monitoring.
- VoiDbg: Projeto e Implementação de um Debugger Transparente para Inspeção de Aplicações Protegidas
- Detecção de ataques por ROP em tempo real assistida por hardware
- Análise Transparente de Malware com Suporte por Hardware
Check out our Youtube playlist.
It is always great to have our efforts acknowledged, so I present here some mentions to this work:
Please tell me if you are using or referring this project.
