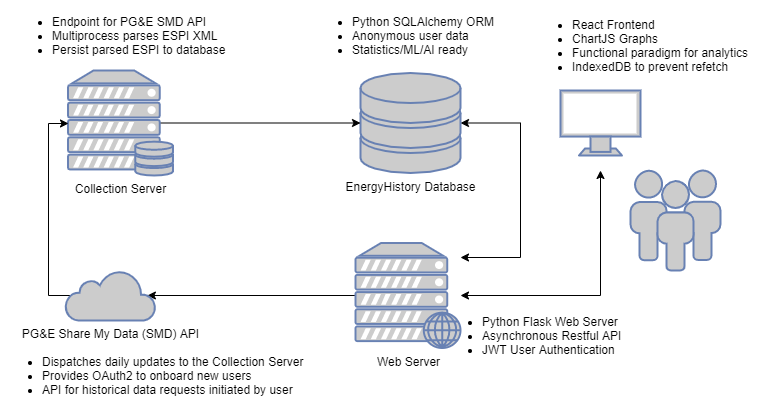
The goal of this project is to analyze and present resource consumption data to users empowering them to conserve and save money.
https://www.openenergyview.com
If you are a PG&E customer you can link your account now! If you are not a PG&E customer you can try the demo and talk to J.P. about integrating your utility.
Process notes here: JPHutchins#31
The following notes are for setting up the environment with a Windows 10 host and Ubuntu 20.04 on WSL2. Please submit a PR if you find necessary adaptations on your environment.
Personally I use VSCode from the Windows host utilizing the "Remote - SSH" and "Remote - WSL" extensions.
git clone [email protected]:JPHutchins/open-energy-view.git
cd open-energy-view
-
Install python requirements
Note: check your python3 version
sudo apt install python3.8-venv build-essential python3-dev -
Create the virtual environment and install packages
python3 -m venv venv source venv/bin/activate pip3 install -r requirements.txt -
Install and configure rabbitmq
- Install erlang:
sudo apt update sudo apt install software-properties-common apt-transport-https wget -O- https://packages.erlang-solutions.com/ubuntu/erlang_solutions.asc | sudo apt-key add - echo "deb https://packages.erlang-solutions.com/ubuntu focal contrib" | sudo tee /etc/apt/sources.list.d/rabbitmq.list sudo apt update sudo apt install erlang - Install rabbitmq
curl -s https://packagecloud.io/install/repositories/rabbitmq/rabbitmq-server/script.deb.sh | sudo bash sudo apt install rabbitmq-server - Start rabbitmq-server
sudo service rabbitmq-server start - Verify that rabbitmq-server is running
sudo service rabbitmq-server status - Configure rabbitmq
sudo rabbitmqctl add_user jp admin
sudo rabbitmqctl set_user_tags jp administrator
sudo rabbitmqctl add_vhost myvhost
sudo rabbitmqctl set_permissions -p myvhost jp ".*" ".*" ".*"
- Install erlang:
-
Install nvm (if you don't have it)
notes: https://github.com/nvm-sh/nvm
curl -o- https://raw.githubusercontent.com/nvm-sh/nvm/v0.39.1/install.sh | bash -
Install npm
nvm install 10.19.0 -
Install frontend packages
cd open_energy_view/frontend nvm use 10 npm install -
Build frontend
Assumes you are at path:
*/open-energy-view/open_energy_view/frontendnvm use 10 npm run build
-
Start the server and workers
- Open four terminals (example from VSCode)
- First terminal:
./run-wsgi-dev - Second terminal:
./run-io-worker - Third terminal:
./run-cpu-worker
-
Open the development site in a browser
- Fourth terminal:
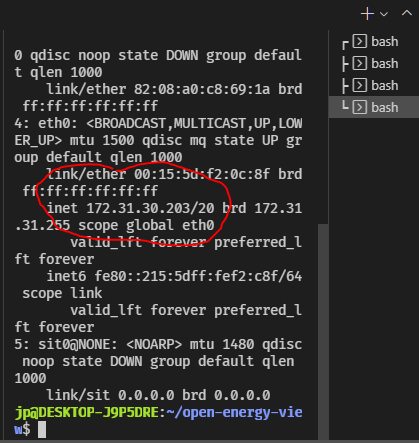
ip a - Note the IP address of your WSL2 instance, in this case
172.31.30.203
- On your host OS, open a Chrome or Firefox web browser and navigate to
http://<YOUR_WSL2_IP>:5000
- Fourth terminal:
For first time setup you must register a user to your local database. Use something easily memorable and keep in mind that you can register as many users as you need while testing.
- Click "Register now!"
- For email use:
[email protected] - For password use:
admin
- For email use:
- You are prompted to add energy sources. This is local development so there would be no way to add a real PGE account here. In the dropdown select "Fake Utility" and click "Authorize".
- You are prompted to name the fake energy source. Enter
dev, for example, then click "Add Source".
After simulating API calls and parsing the retrieved ESPI data (J.P.'s old data) you will be greeted with an OEV instance that will respond to changes in your local Python/Flask/Celery backend and React frontend.
Data is presented always by Watt hour (Wh). This is so that the user can compare different time intervals to one another. It is not meaningful to compare 630,000 Watts consumed in the month of June to 30,000 Watts consumed last Tuesday. Rather, we would like to understand the intensity of usage (average) of different time intervals. Usefully, we can see that the average 1,250 Watt hours consumed last Tuesday is higher than the average 875 Watt hours consumed during June.
A partition is a time interval that recurs each day. The default partitions are:
- Night: 12AM -> 7AM
- Day: 7AM -> 6PM
- Evening: 6PM -> 12AM
These partitions allow the user to develop conclusions about what activities are using the most resources.
Passive consumption is the amount of a resource a building will use even when no person is actively utilizing the energy. This is calculated statistically using a rolling mean and rolling standard deviation. This passive consumption metric can account for an outsized amount of electricity utilized in a building since it is by definition always consuming energy.
Presentation of this very useful metric allows users to understand the impact of passive appliances on their resource consumption as well as empowers them to find and disable devices that they do not need 24/7.
The activities pie chart shows the user how much power each activity consumed over the current time window.
Various trends are calculated to give the user realtime feedback on their resource conservation efforts.
This tend shows about how much power the user is using during this "time of the year" this year vs this "time of the year" last year. The time range is +/- 14 days to attempt to mitigate the impact of statistical outliers like unseasonably hot or cold weather.
This trend shows the active use trend up to this point. Examples of active use:
- Appliances
- TVs
- Computers
- Lighting
This trend shows the passive used trend up to this point. Examples of passive use:
- Network Equipment
- Security Systems
- HVAC
- IoT devices
Green Button and ESPI
https://www.energy.gov/data/green-button
https://green-button.github.io/developers/
http://www.greenbuttondata.org/


